Selecting a chart type
Based on the dimensions and measures selected, you can select one of the available chart types from the Chart section to visualize the data.
Steps
-
Based on the combination of selected dimensions and measures, the available chart types displayed on the Chart section vary.
By default, the following chart types are available:
- Bar Chart - Select the
 icon to view the data in a bar chart format as well as
tabular format. Refer to step 2 for more details.
 - Column Chart - Select the
 icon to view the data in a column chart format as
well as tabular format. Refer to step 2 for more details.
 - Pie Chart - Select the
 icon to view the data in a pie chart format as well as
tabular format. Refer to step 3 for more details.
 - Line Chart - Select the
 icon to view the data in a line chart format as well
as tabular format.
 - Area Chart - Select the
 icon to view the data in an area chart format as well as tabular format. Refer to
step 4 for more details.
 - Table - Select the
 icon to view the data only in a tabular format.
 - Pivot Table - Select the
 icon to view the data in a pivot table format as
well as tabular format.
 - Count - Select the
 icon to view the count of data.
 - No Visualization - Select the
 icon to view the detailed data for the selected dimensions and measures in a
pivot table. A widget saved without a selected chart cannot be added to a dashboard.Note: The pivot table view displays data when two dimensions and one or more measures are selected. If you select more than two dimensions, the pivot table view is not created, and the data is displayed only in a flat table.
- Bar Chart - Select the
-
Following is the behavior of Bar Chart and Column Chart:
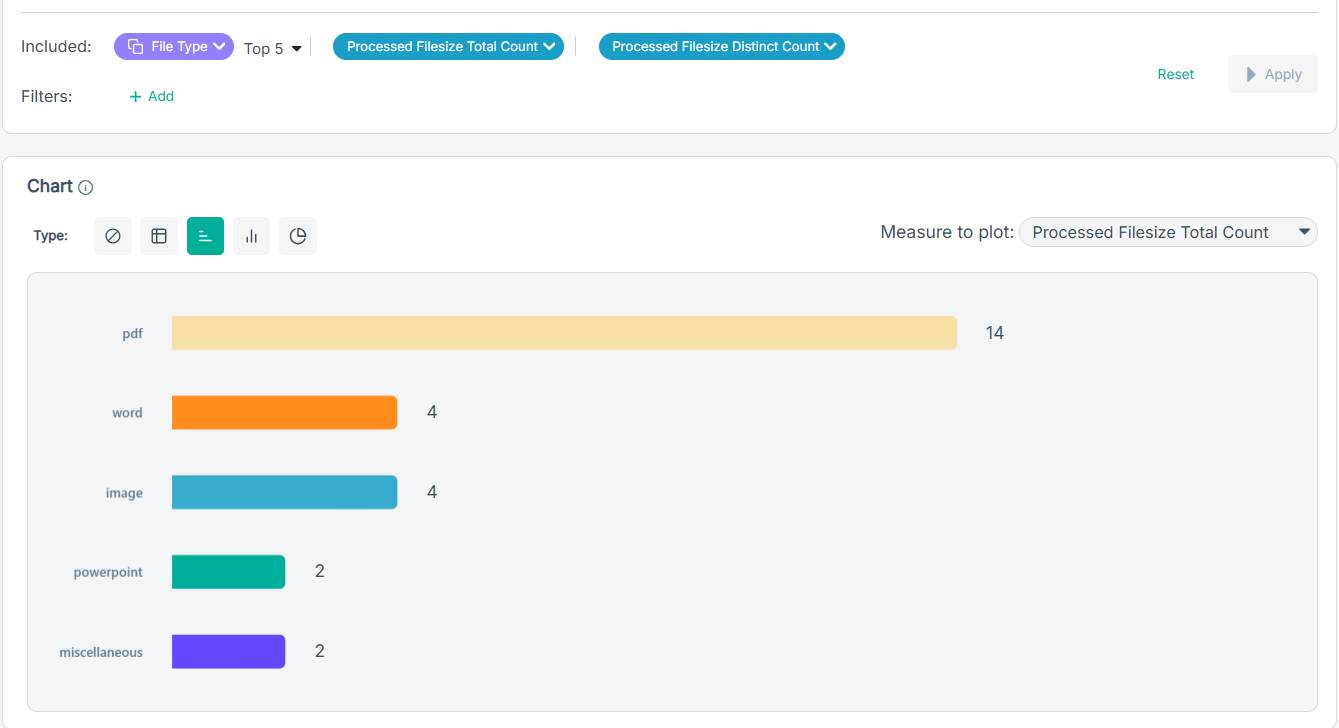
- For a query with a single dimension and a single measure, the Bar Chart or Column Chart displays the bar chart or column chart as per the selection.
- For a query with a single dimension and multiple measures, the Bar Chart or Column Chart allows selection of the
Measure to plot.
The Measure to plot drop-down displays all measures added to Included along with the All Measure option:
- Select the applicable measure to view only the selected measure's contribution for the dimension.
By default, the first measure added to Included is selected.
- Select the All Measure option to display all the measures selected in the query.
- Select the applicable measure to view only the selected measure's contribution for the dimension.
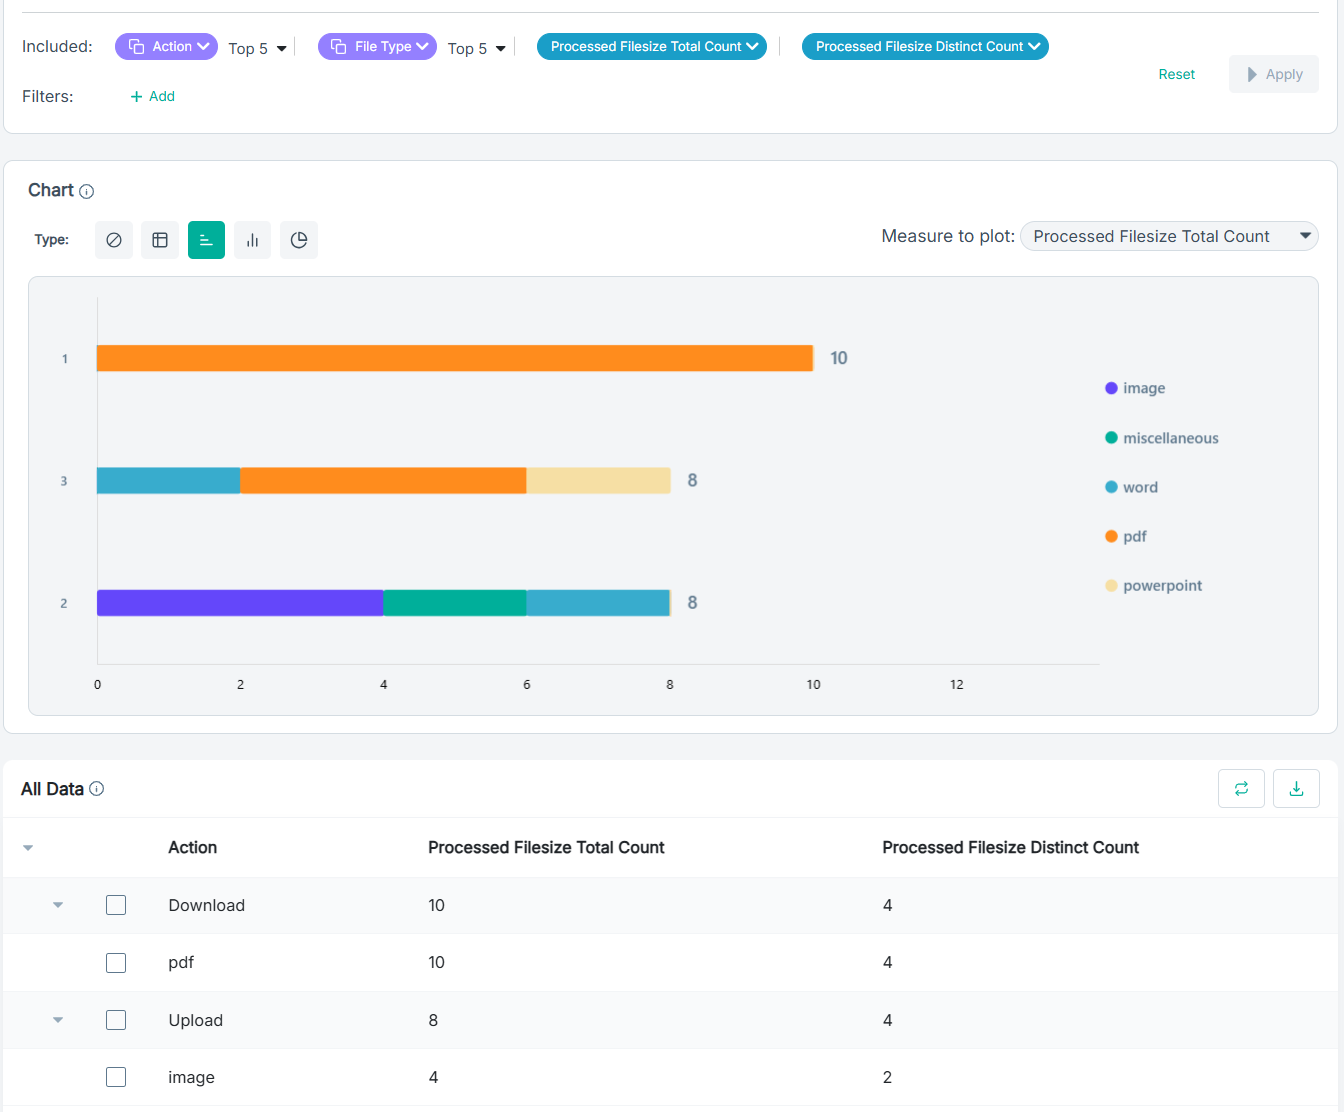
- For a query with two dimensions and multiple measures, the Bar Chart or Column Chart displays stacked bars for the first
dimension selected and allows selection of the Measure to plot. The Stacked bars contain sub-bars based on the relative contribution to first
dimension value, which is further broken by second dimension, that is a sub-bar is shown for each second dimension that has a non-zero value.
The Measure to plot drop-down displays all measures added to Included along with the All Measure option.
- Select the applicable measure to view only the selected measure's contribution for the first dimension.
By default, the first measure added to Included is selected.
- Select the All Measure option to display all the measures selected in the query for the first dimension.
- Select the applicable measure to view only the selected measure's contribution for the first dimension.
-
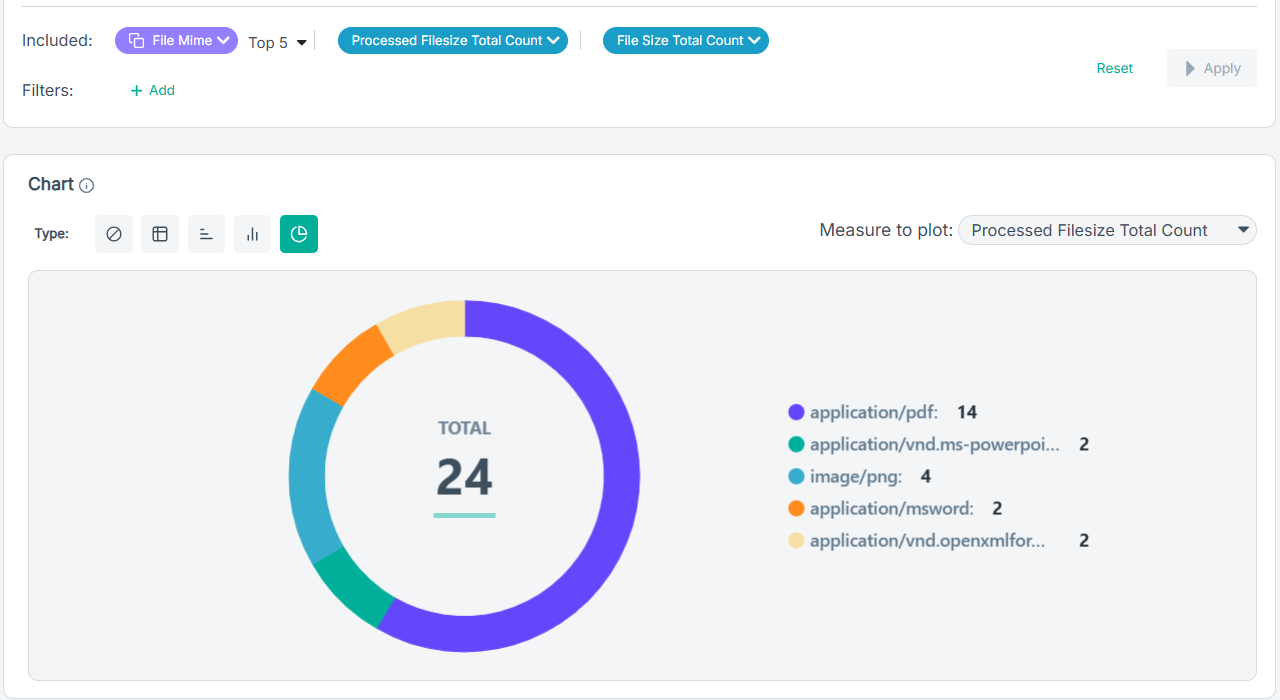
Following is the behavior of Pie Chart:
- For a query with a single dimension and a single measure, the Pie Chart directly displays the pie chart as per the selection.
- For a query with a single dimension and multiple measures, the Pie Chart allows selection of the Measure to plot. By default, the first measure added to Included is selected.
-
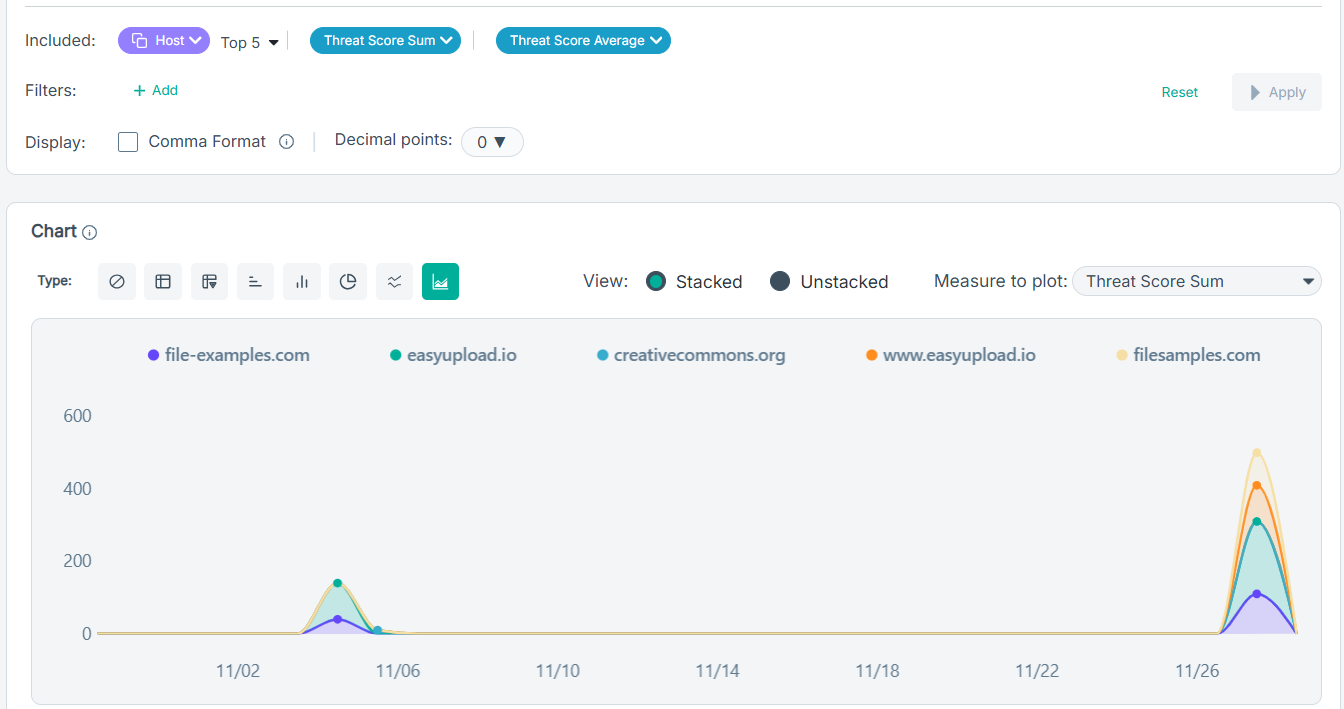
Following is the behavior of Area Chart:
- The Area chart type is supported with a single dimension and multiple measures.
- The Area chart type supports Stacked and Unstacked view. By default, the stacked view is selected.
- For a query with a single dimension and a single measure, the Area Chart directly displays the Area chart as per the selection.
- For a query with a single dimension and multiple measures, the Area Chart allows selection of the Measure to plot. By default,
the first measure added to Included is selected.
-
In the All Data section, the results of the query is displayed. The data is displayed in a pivot table view for queries up to two dimensions. For queries
with three or more dimensions, data is shown in a flat table.
- For queries up to two dimensions and a single measure, the pivot table displays data bars for the single measure selected.
- For queries up to two dimensions and multiple measures, the pivot table displays the Show bars drop-down, where you can select the applicable measure
to display or hide data bars.
- Select the For All option to display data bars for all the measures selected in the query.
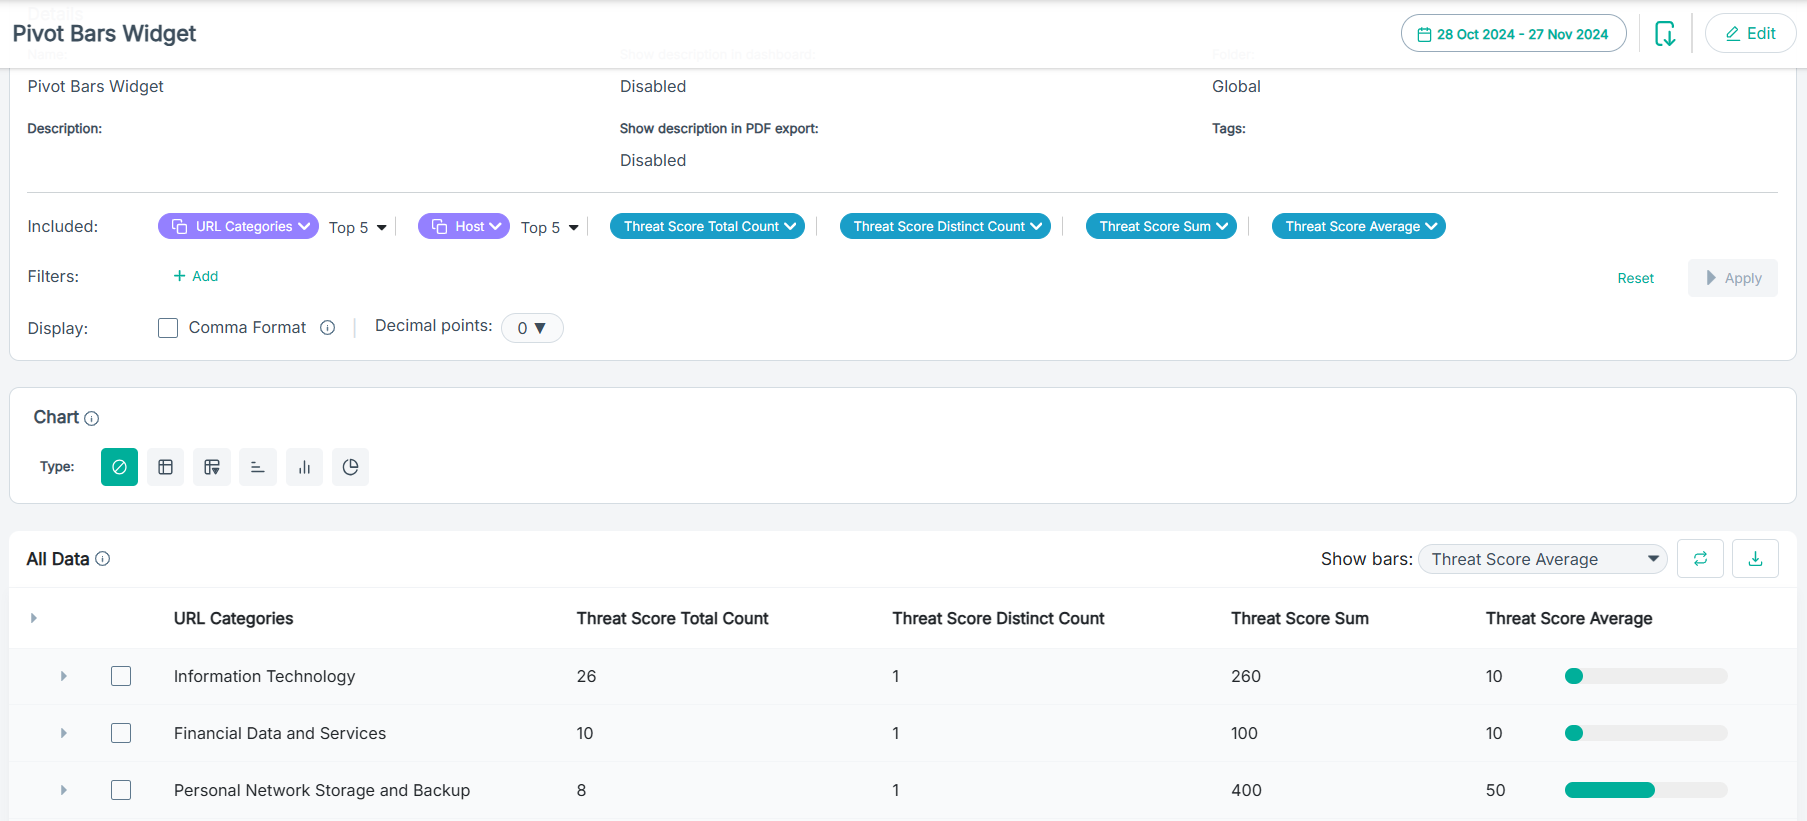
- Select the For None option to hide data bars for all the measures selected in the query.
- Select the For All option to display data bars for all the measures selected in the query.
To filter data using the advanced filter option available in the All Data section, refer to Filtering result data using the pivot view.
You can also sort the data in pivot table or table by clicking the column name. The sorted column displays an up or down arrow to match the sort order.
- To save the widget based on the entered parameters and values, click Save.