You can create widgets under the Discover page and use those widgets as standalone reports or while configuring custom dashboards.
Follow the steps below to create a widget:
Steps
-
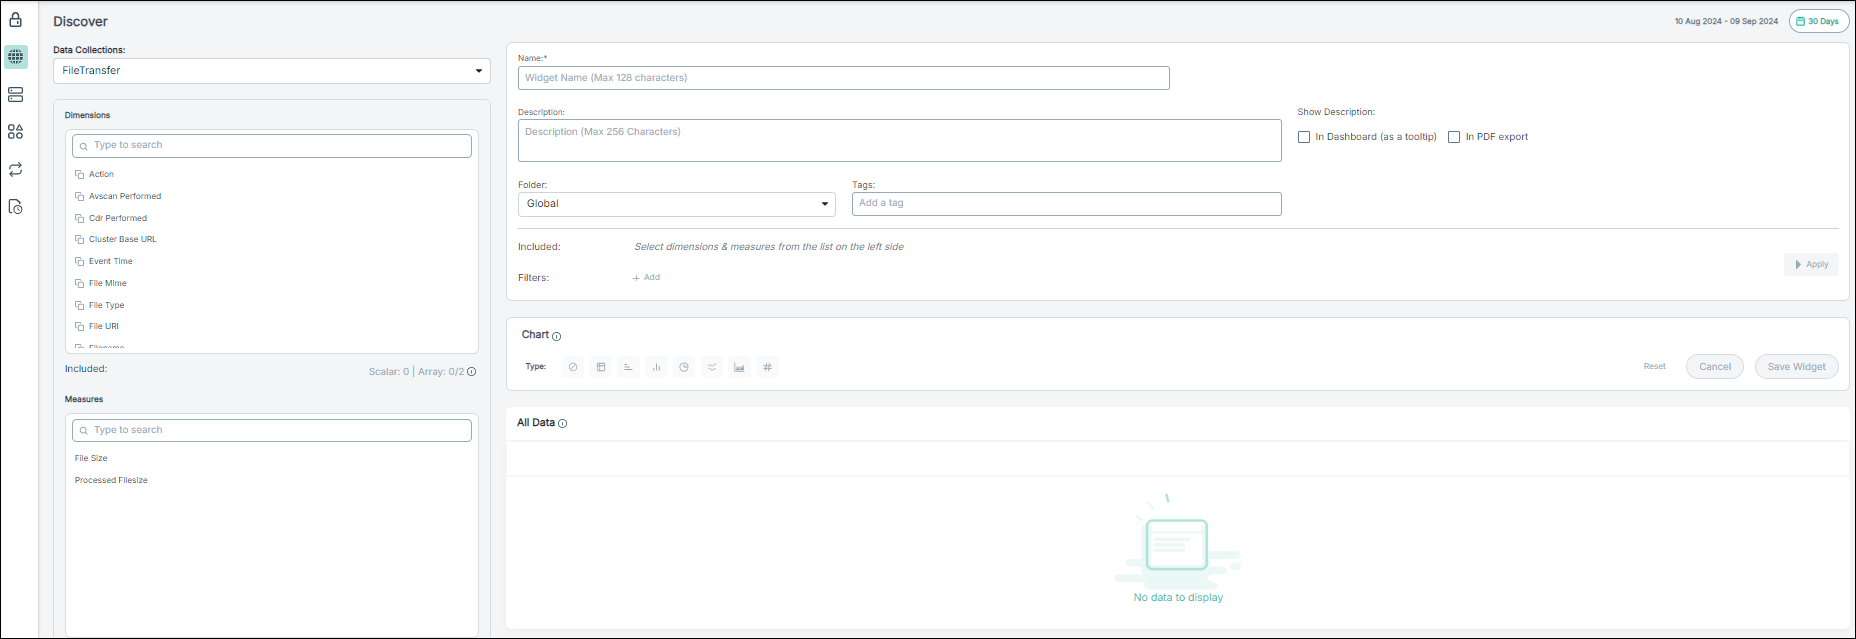
From the left pane, click the
 icon to open the Discover page.
OR
While you are on the Widgets tab of Catalog page, click Create New to open the
Discover page.
-
In Name, enter the widget name.
-
In Description, add a description for the widget.
-
To display the description as a tool tip in the dashboard, select the In Dashboard (as a tooltip) check box.
-
To display the description in PDF export, select the In PDF export check box.
-
Assign the widget to a folder. For more information, refer to Assigning a dashboard or widget to the folder.
-
In the Tags field, enter any tags associated with the widget.
-
From the Data Collections drop-down, select the data source.
-
Select the dimensions and measures.
-
Add filters, if required.
-
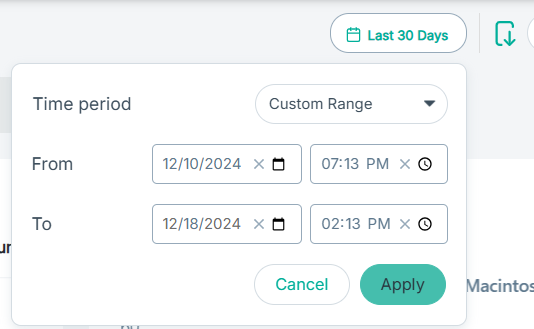
Adjust the report time frame for your widget.
-
Click the time filter.
-
To filter logs based on selected Time period, select one of the following:
- Last Hour
- Last 24 Hours
- 7 Days
- 14 Days
- 30 Days
- 45 Days
- 60 Days
- Custom Range
-
If you have selected the Custom Range option, then:
- To select a From date for your transaction view, enter a date or select the date from the calendar and then click the time icon to select the
time range.
- To select a To date for your transaction view, enter a date or select the date from the calendar and then click the time icon to select the
time range.
Note: The date and time formats are the same as those configured on your system.
-
To save the changes, click Apply.
-
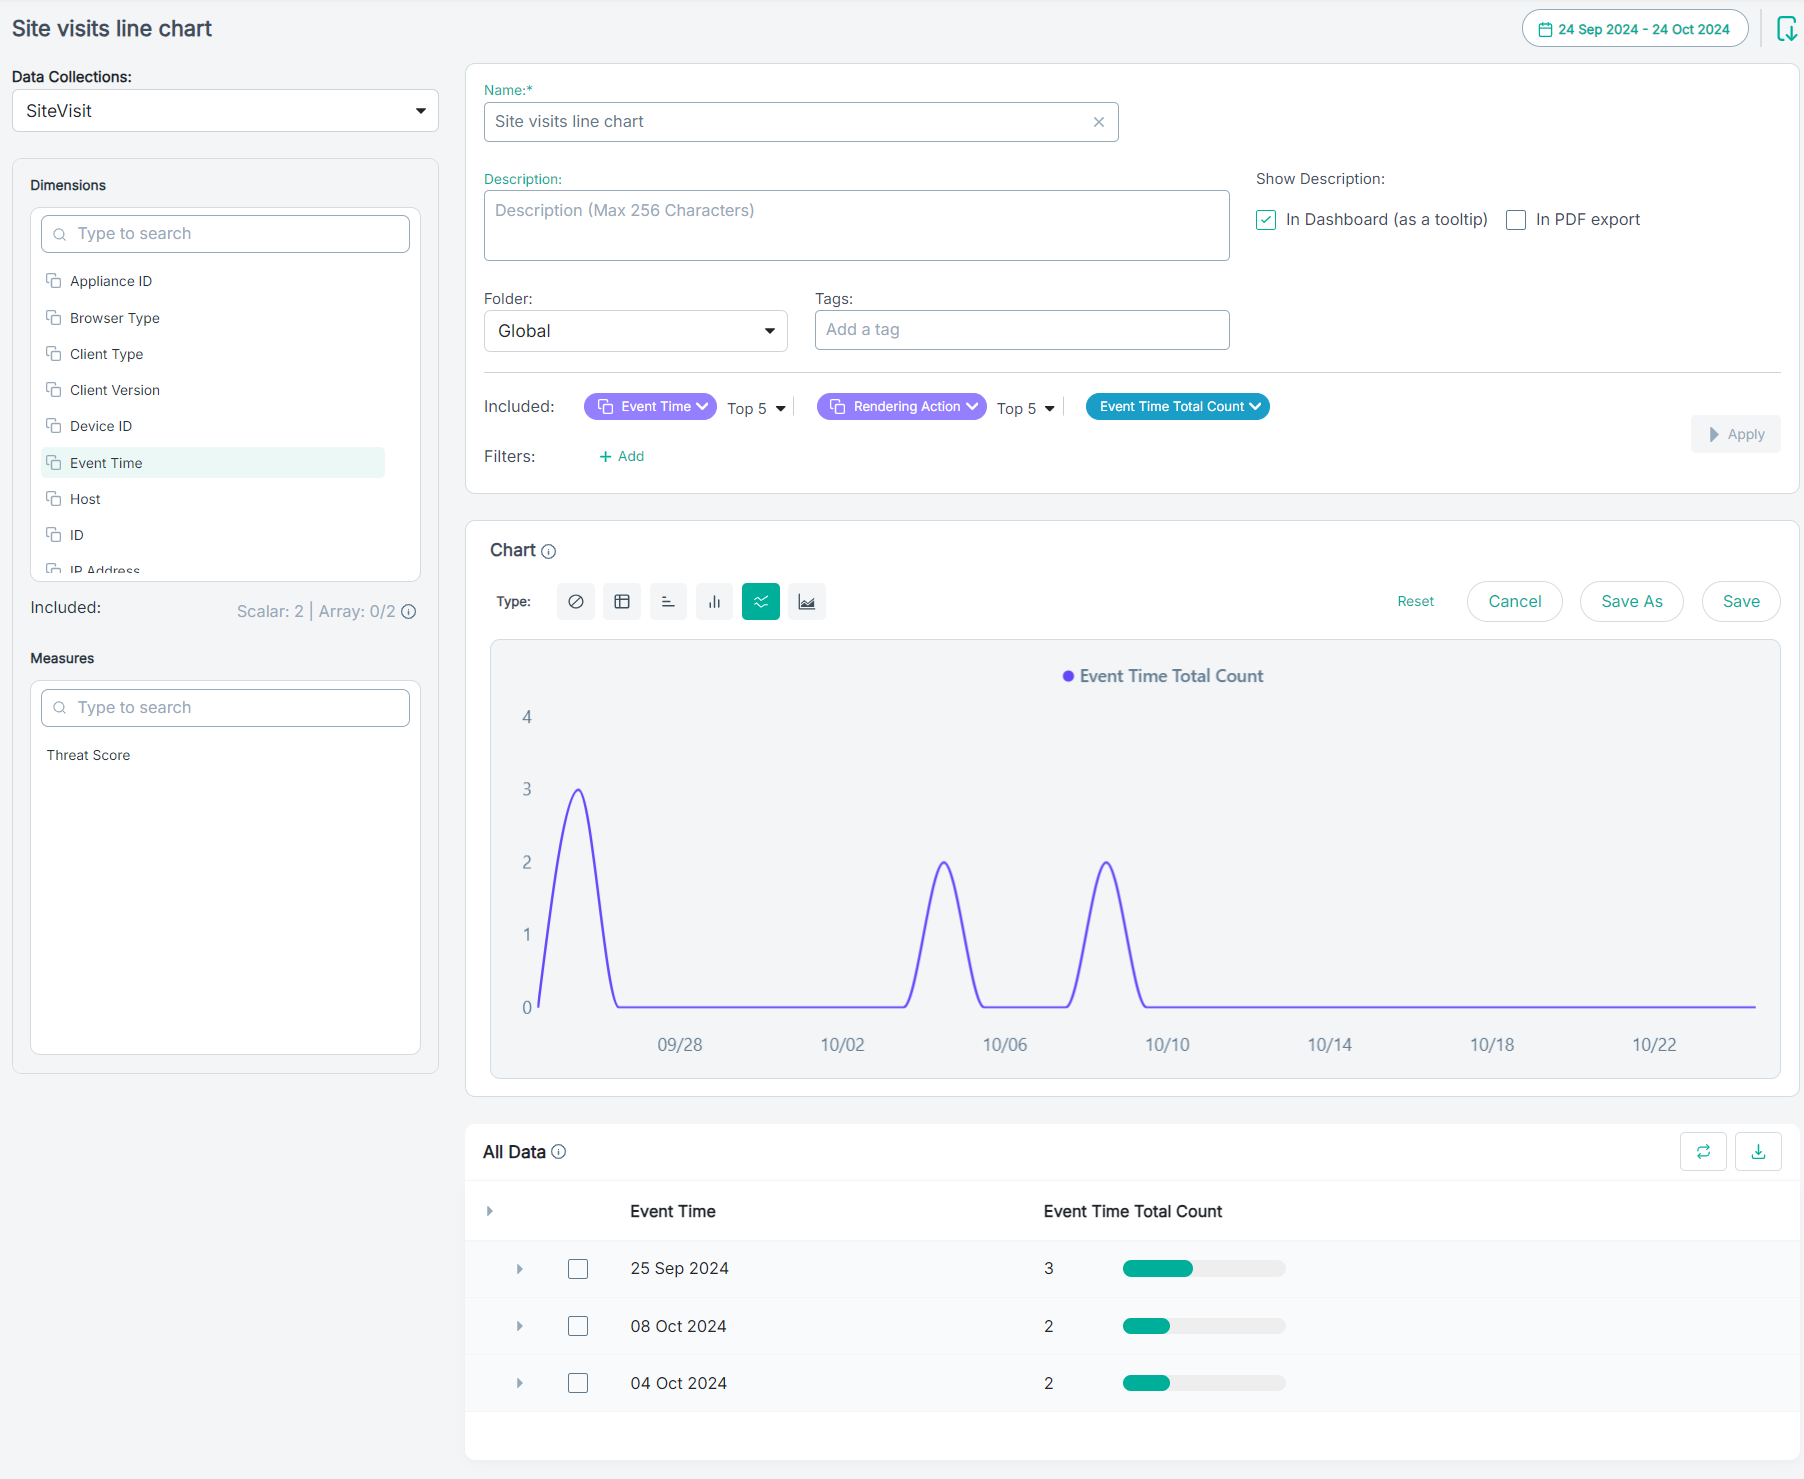
Click Apply to generate the query and widget based on the dimensions and measures selected.
Note: You can also modify filters, sort data, and change the number of entries displayed even after you click the Apply button.
-
To include comma (,) as a thousands separator, select the Comma Format checkbox.
-
From the Decimal points drop-down, select the number of decimal points to display more precise value in the Chart and All
Data sections.
Available options are:
- 0 - None
- 1 - rounded to 1 decimal place
- 2 - rounded to 2 decimal places
-
In the Chart section, select chart type from Type to visualize the data based on the dimensions and fields selected.
If the report time frame is set to Last 24 Hours, the chart displays data points aggregated for each hour, whereas for the Last
Hour, it shows data aggregated for every 5 minutes.
-
In the All Data section, the results of the query is displayed. The data is displayed in a Pivot table if the query contains upto two dimensions.
For greater than two dimensions, the data is presented in a flat table.
-
To clear the selections, select Reset.
-
To save the widget based on the entered parameters and values, click Save.
The widget appears in the assigned folder on the Widget tab of the Catalog page. You can use these widgets as standalone
reports or when configuring custom dashboards.