Adjusting Economic Value
The Economic Value allows you to understand the potential return on investment for your use of Forcepoint ONE. To use this effectively you should tailor the calculation for your Industry and your use of Forcepoint ONE.
The economic value is calculated as the sum of the following metrics:
- Data Breach Protection – Refers to the estimated savings from the Data Breach Protection offered by Forcepoint ONE.
- Non-Compliance Protection – Refers to the estimated incremental savings for organizations operating in environments that require compliance with specific industry regulations.
- Zero Trust Protection – Refers to the estimated incremental savings for organizations that have implemented zero trust and are typically dealing with 3rd parties and supply chains.
- Unsanctioned Apps Protection – Refers to the estimated savings for organizations dealing with data storage in the Cloud and the potential increased risk of the use of unsanctioned applications.
- Ransomware Protection – Refers to the estimated savings through use of the Ransomware Protection capabilities offered by Forcepoint ONE.
The Economic Value is calculated by taking the daily value for each of the above metrics and then calculating the economic value based on the Summary dashboard for the time period selected and the economic value for the Year to Date.
For example, in the following case:
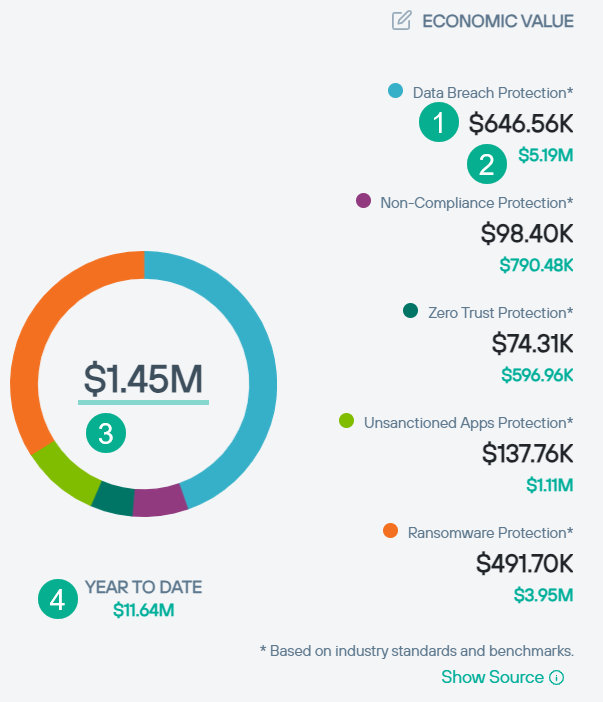
- Shows the value of $646.56K as the estimated economic return for Data Breach Protection for the time period selected. The calculation changes if the time period selected on the Summary dashboard changes (between 7, 14, 30, 45 or 60 days).
- Shows the value of $5.19M as the estimated economic return for Data Breach Protection for the year to date. In this case, the calculation is based on number of elapsed days in the year
including the current day.
For example:
- On the first of January, this value would show the estimated economic return for a single day
- For the 31st December, this value would show the estimated economic return for 365 (366 days in a leap year).
- Shows the value of $1.45M as the estimated economic return across all metrics for the time period selected. The calculation changes if the period selected on the Summary dashboard changes (between 7, 14, 30, 45 or 60 days).
- Shows the value of $11.64M as the estimated economic return across all metrics for the year to date. As above the calculation is based on number of elapsed days in the year including the current day.