Live events
Live events page can be used view and filter user actions on files as they happen on data sources where event streaming is configured.
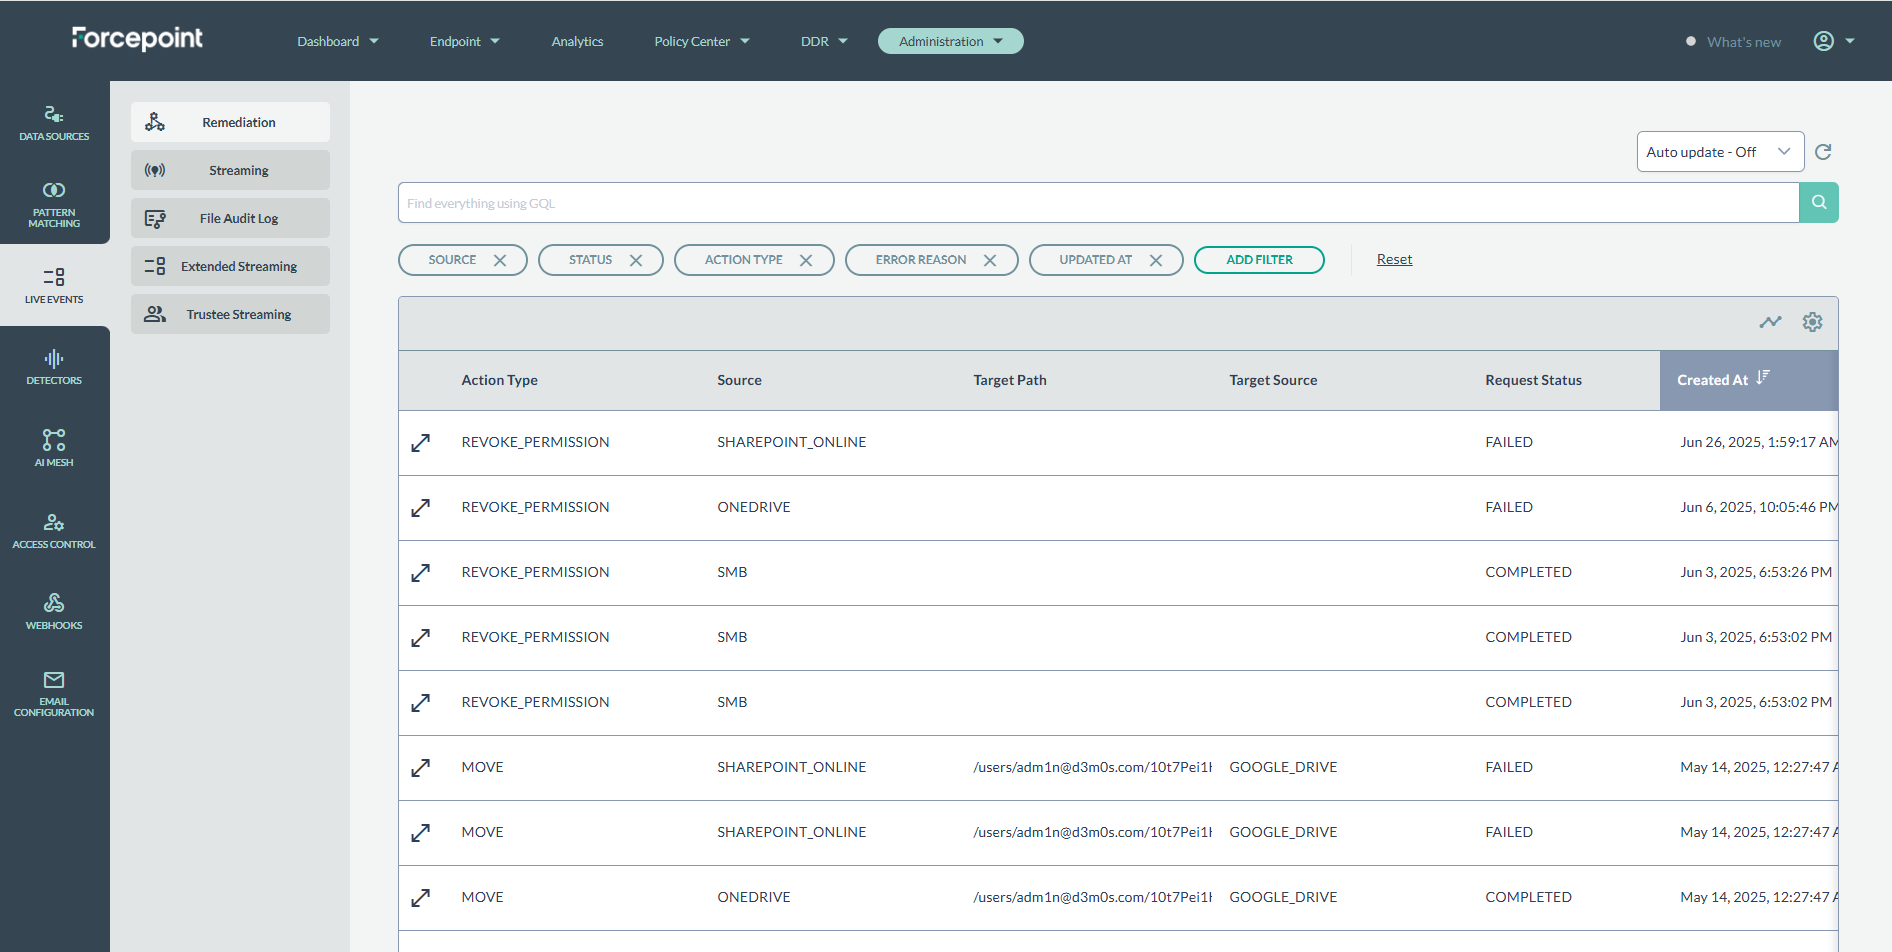
Remediation
Mitigate risk after a user action, for example: if user shared a file publicly, but it was found to be a highly confidential document - public share can be removed using the DSPM.
Navigate to .
- A remediation log record with a Queued status is created for each file in enterprise search that matches the provided GQL.
- After all remediation log records are generated, the actual processing begins.
- The scan-data-manager issues small batches to the scan-manager for processing.
- The results of the move operation are then sent back from the scan-manager to the scan-data-manager, which updates the remediation log records with the appropriate status.
- Only files smaller than 15 MB can be moved.
- The file size is evaluated at runtime in the scan-manager, as the file may change between scans.
- Files exceeding this limit are marked with a CONNECTOR_ERROR, along with the error message:
400 BAD_REQUEST: "File size exceeds the limit of 15728640
                bytes"
- If the destination folder already contains a file with the same name as the one being moved, the operation will fail.
- This results in a CONNECTOR_ERROR with the message:
409 CONFLICT: "Connector could not upload file. Reason: File already exists: <full_file_path>"
- This results in a CONNECTOR_ERROR with the message:
- If a file has already been moved or deleted between the last scan and the move operation, the move will fail.
- In such cases, the error will be marked as CONNECTOR_ERROR with a message similar to:
404 NOT_FOUND: "Connector could not fetch file. Reason: File not
                found".
- In such cases, the error will be marked as CONNECTOR_ERROR with a message similar to:
Additional Details on Limitations
There are internal constraints governing how matching is performed and how frequently queued files are submitted for processing. By default, the system processes files at a rate of 100 every 5 minutes, which translates to 1,200 per hour or 28,800 per day.
A scheduled job in the scan-data-manager service runs every 5 minutes. It identifies an active batch and submits up to 100 queued files for processing, updating their status to in_processing. If multiple active batches exist, one is selected at random. New files will not be submitted to a batch if it already has more than 50 files in the in_processing state.
APP_SCHEDULERS_REMEDIATION_PROCESSING_RATE=PT5M
APP_SCHEDULERS_REMEDIATION_PROCESSING_MAX_CONCURRENT=100
APP_SCHEDULERS_REMEDIATION_PROCESSING_PUBLISH_THRESHOLD=50
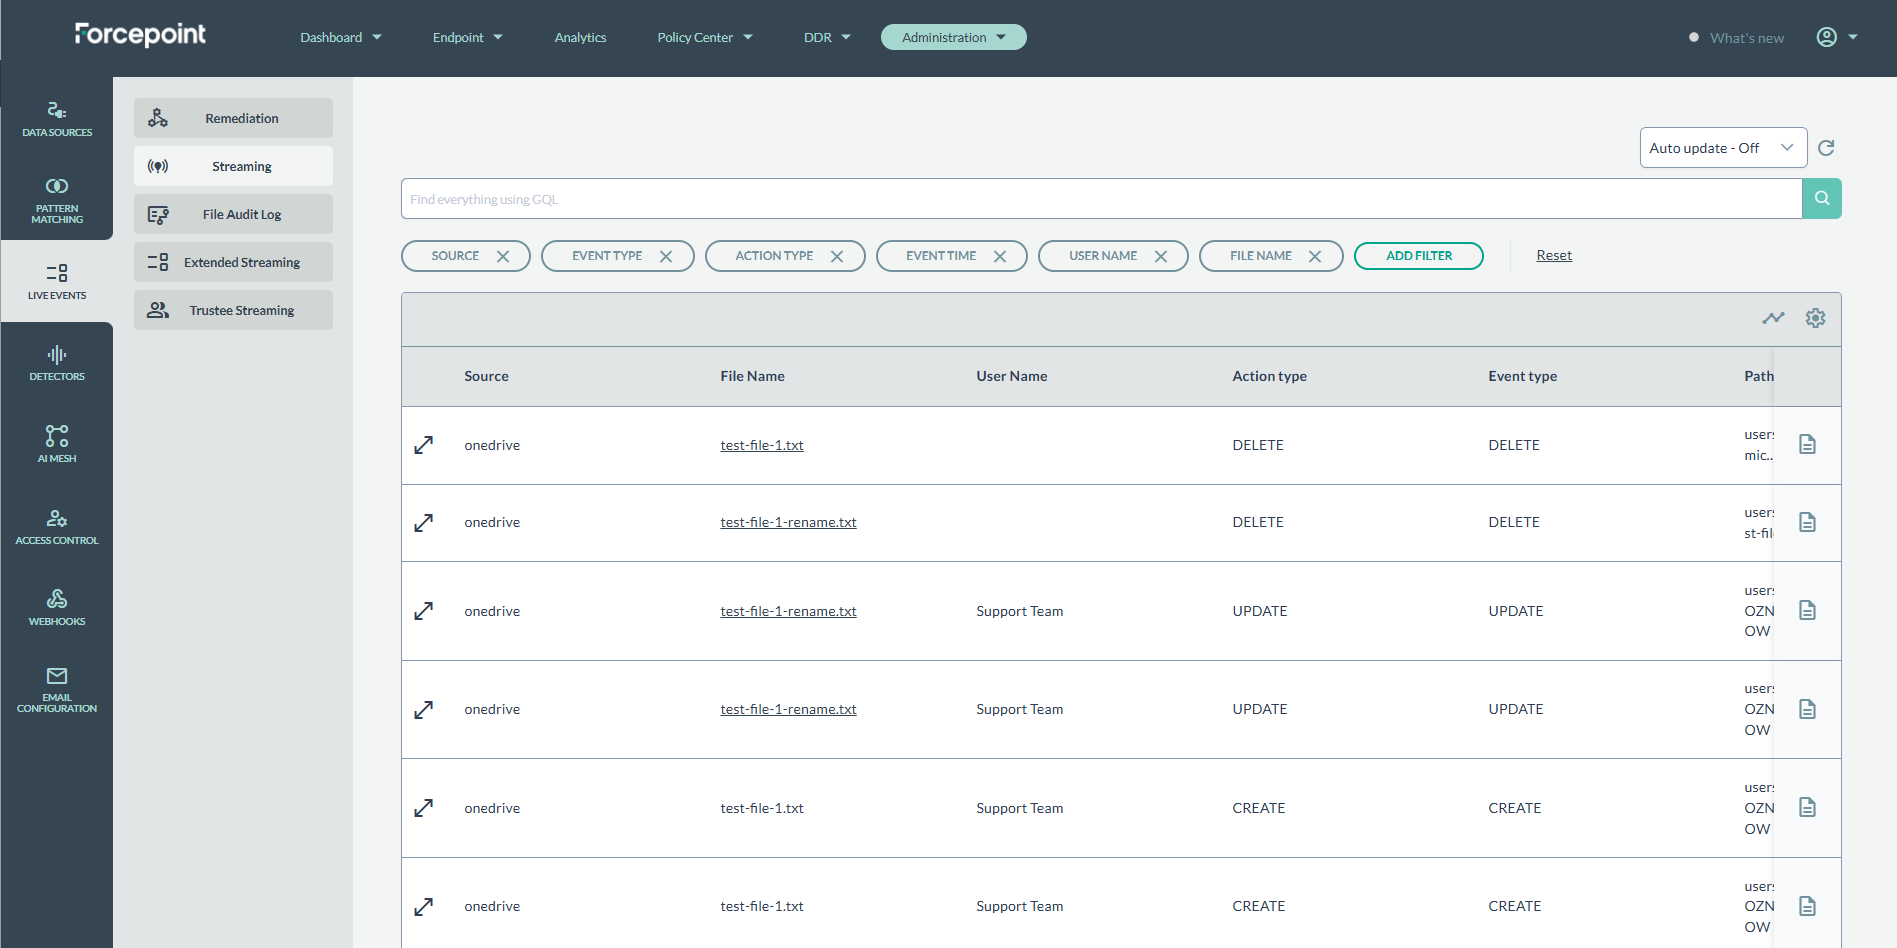
Streaming
Filter user actions on files as they happen on data sources where event streaming is configured.
Navigate to .
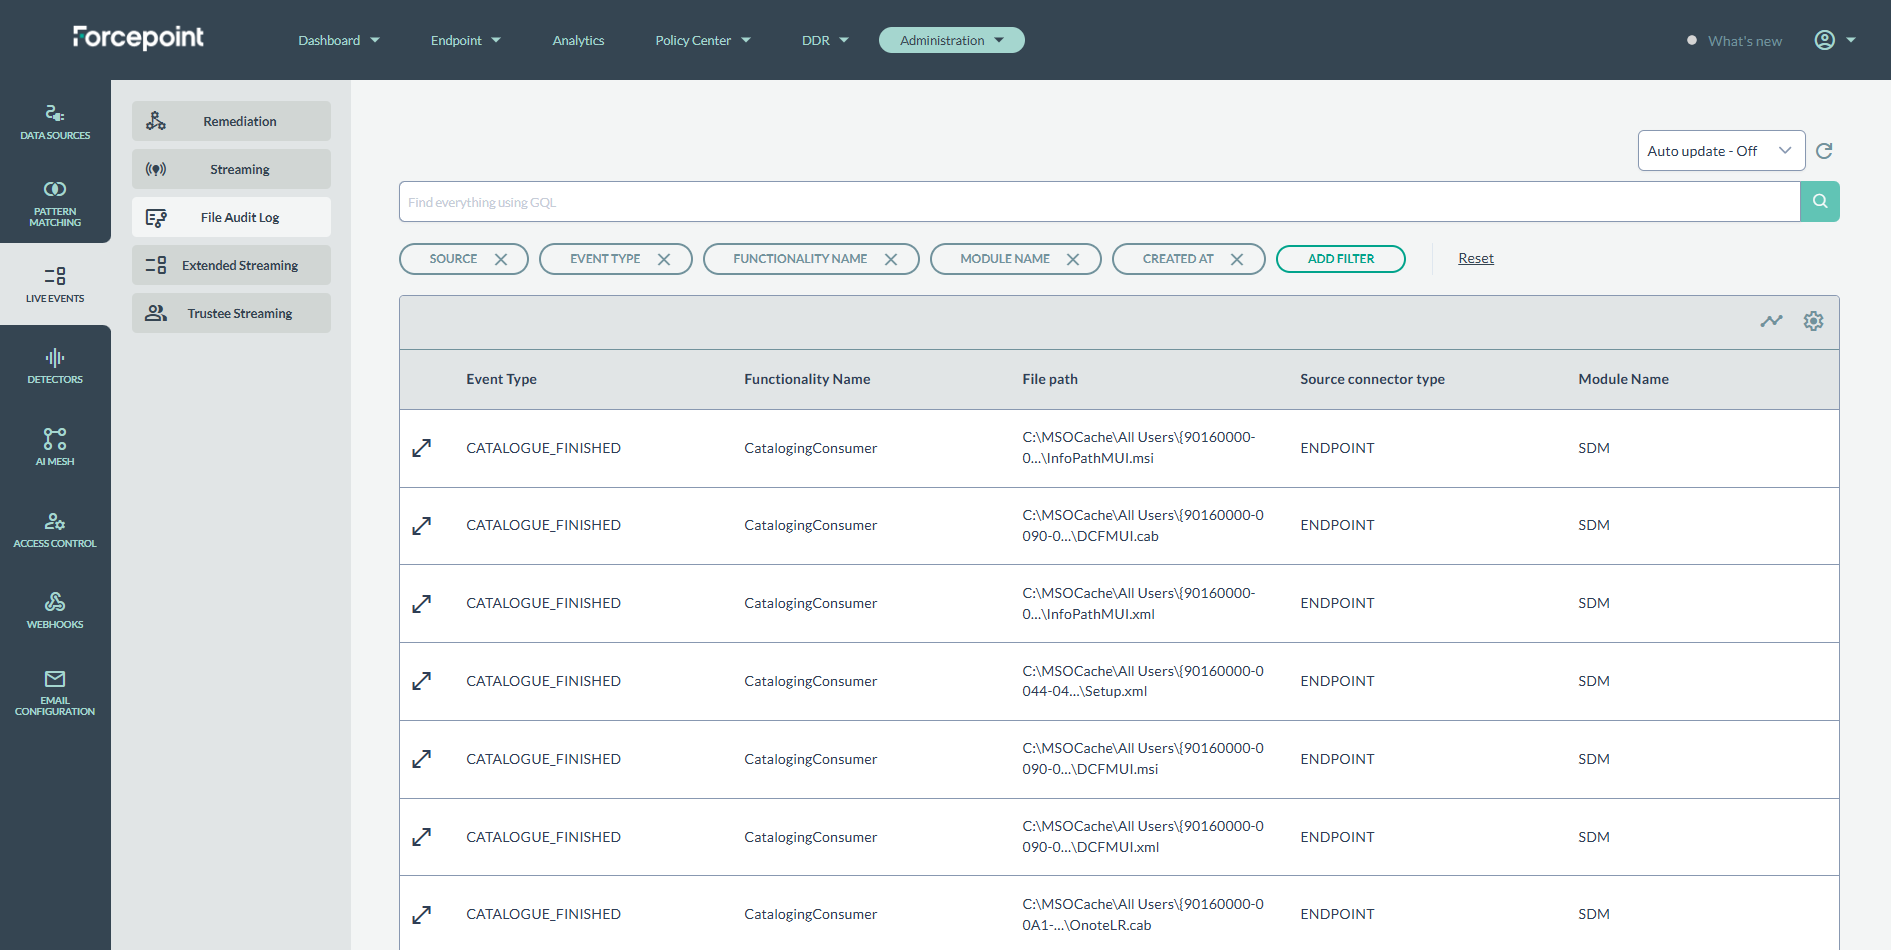
File Audit Log
Events that occurred during a scan or during endpoint discovery (e.g. file was discovered by endpoint agent, or file was ingested/classified by scanner).
Navigate to .
Extended Streaming
Extended Streaming is the expanded data-collection and event-ingestion layer in the DSPM platform that goes beyond Trustee Streaming’s core “file access + permissions + data usage” telemetry. It is designed to pull, normalize, and continuously stream additional contextual signals from multiple enterprise systems, allowing DSPM to build richer risk models, deeper identity context, and enhanced data governance insights.
Extended Streaming ingests multiple event types that complement Trustee Streaming:
- Identity & Directory Changes
- Tracks permission drift in near real time
- Extended Streaming monitors: Folder renaming, repository structure changes, moves, copies, and migrations, updates to storage metadata etc. These changes are reflected instantly in dashboards (without waiting for a re-scan).
- Device and Endpoint Context
- Behavioral Telemetry: File read/write frequency baselines, Unusual access patterns, Off-hours behavior, Large data movement baselines, High-risk user patterns
Benefits
- Real-time Access Governance
- Dynamic Data Exposure Dashboards
- Identity-Aware Risk Modeling
- Anomaly Detection
- Faster Governance Cycles
Navigate to .

Trustee Streaming
Trustee Streaming is a continuous, real-time visibility and monitoring pipeline inside DSPM that tracks file access, user behavior, permissions, and data-movement activity across an organization’s unstructured data stores (SharePoint, OneDrive etc.).
Navigate to

How Trustee Streaming Works (High-Level Architecture)?
- Connectors collect access events such as: File R/W operations, permission changes, etc. These events are sent to the Trustee Streaming pipeline.
- Raw events are enriched in real time with identity (user → department, file metadata, sensitivity, context information (source location, device, access method), risk level (user risk, file risk, exposure risk).
- Events are streamed into the Trustee Engine which normalizes events into the data models.
- Real-time access monitoring
- Effective permissions computation
- Behavioral analytics
- Stale access detection
- Access governance
- Exposure and link tracking
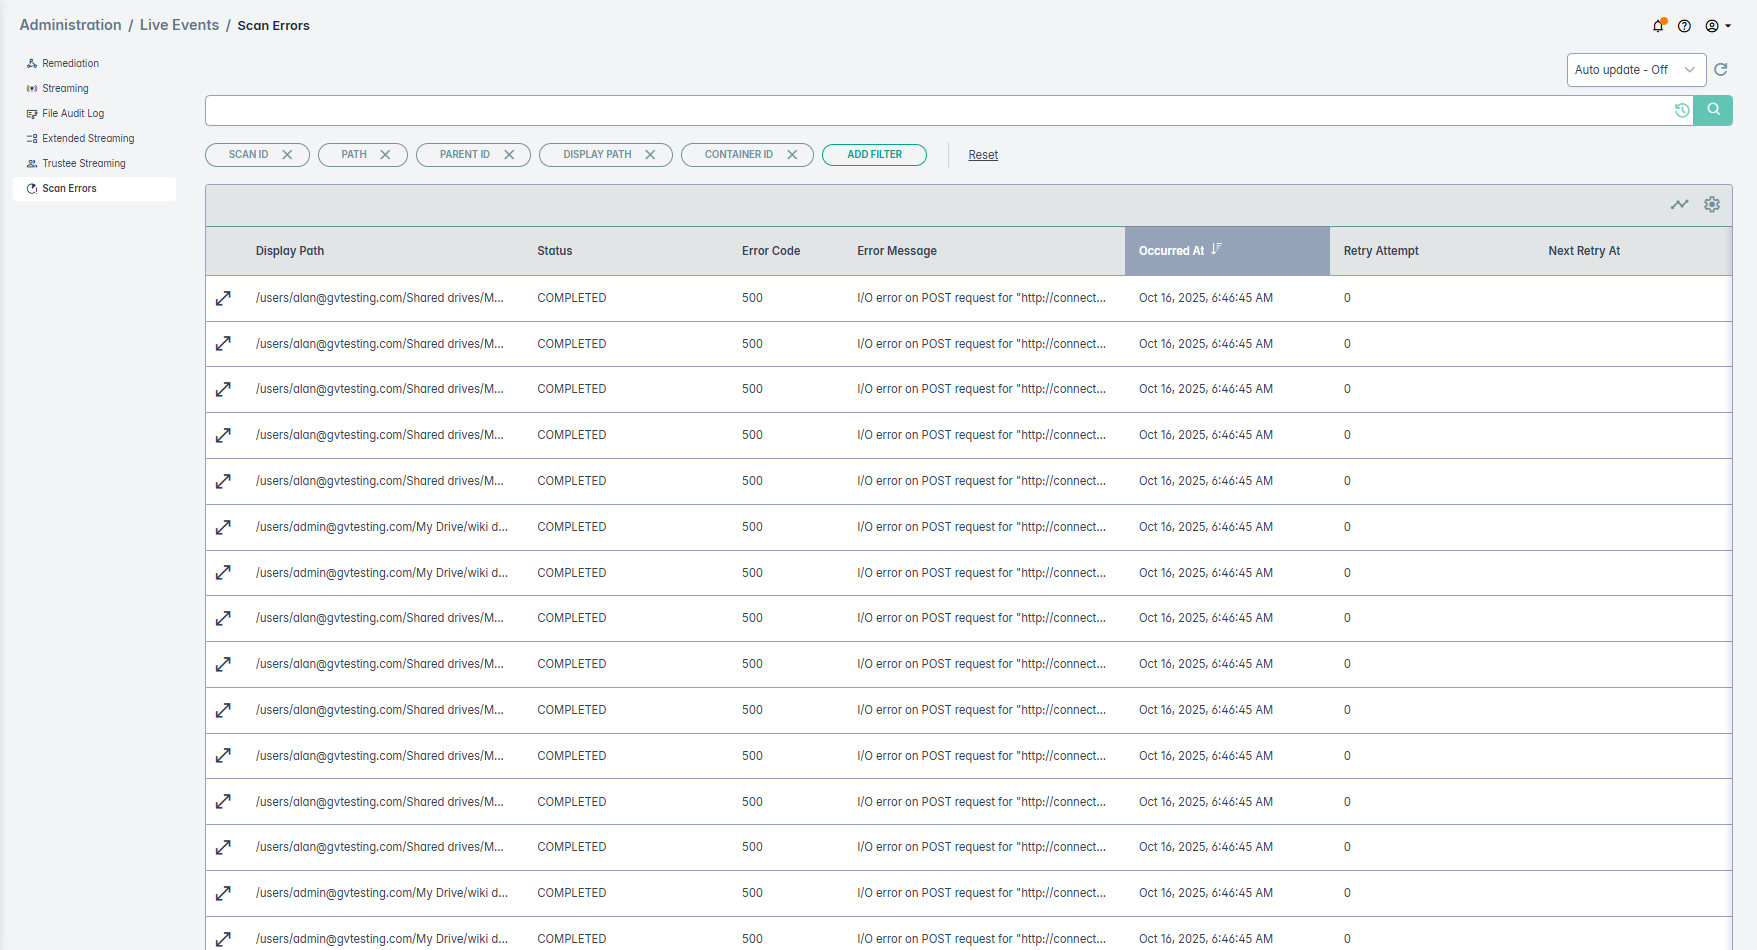
Scan Errors
The Scan Errors page lists items that could not be processed during a scan. Use it to diagnose connectivity problems, fix permission issues, and check classification coverage for both file and database data sources.
Errors are recorded per item. A scan can finish while still logging errors for specific files, schemas, tables, or columns.
Types of scan errors
| Data source type | Item | Example errors |
|---|---|---|
| Unstructured (files) | File or folder | Access denied, unsupported file type, read timeout |
| Structured (databases) | Schema, table, or column | The error code and message returned by the database connector, such as a permission refusal on a table or a dropped connection |
Viewing scan errors
- Go to and select the data source.
- Open the scan history and select the scan you want to investigate.
- Open the Scan Errors tab.
- Review the items that encountered errors.
| Field | Description |
|---|---|
| Display Path / Item | The file path, schema, table, or column that encountered the error. |
| Path | The system path or identifier of the item. It often matches Display Path. |
| Data Source / Connector Type | The data source configuration or connector type associated with the scan. |
| Status | The result of the retrieval attempt: FAILED, SUCCESS, or IN_PROGRESS. This is the status of the individual item. It is not the
scan status. |
| Error Code | The status code returned by the underlying connector, such as 403 or 500. This is the raw code, not a categorized error type. |
| Error Message | The text returned unchanged by the database driver or connector, truncated to 2,000 characters. Wording varies by database platform and driver version. |
| Occurred At | When the error occurred. |
| Retry Attempt / Next Retry At | The number of retries so far and the scheduled time of the next one. |
| Id, Configuration Id, Container Id, Scan Id | Identifiers for the failed item, its configuration, its container, and the scan. |
Fixing database scan errors
DSPM records the raw response from the connector, not a categorized error type. Read the error code and message together to find the cause. The most common cases are below.
- Cause: The DSPM service account lacks
SELECTorREADpermission on the schema or table. The driver message usually names the object and the refused privilege. - Action: Ask your database administrator to grant read access to the DSPM service account on that schema or table, then run the scan again.
- Cause: DSPM could not reach the database host in time, or the connection dropped while reading schemas. The driver message usually mentions a socket, timeout, or listener failure.
- Action: Check network connectivity between DSPM and the database host, including firewall rules, VPN settings, and the database listener. Then open the connector configuration under Data Sources and confirm the host, port, and credentials.
- Cause: The column was discovered and cataloged, but classification failed, for example because of an unsupported data type or a classification policy error.
- Action: Compare the column data type with the supported classification targets. If the error points to a policy, review the classification policy configuration.
Scan errors and the overall scan status
- Structured data scans end as Completed. This also applies when a scan-level failure occurs, such as an unreachable database host. The failure is recorded as a scan error. Structured data scans do not use the Incomplete status.
- Completed does not mean error-free. It means the scan finished running. It does not mean every item was scanned and classified. Always check the Scan Errors tab, because failed items reduce classification coverage.
- There is no Failed scan status. The scan status alone never tells you that a scan had problems. For a list of statuses, see Scanning Data Sources.
Retrieving scan errors through the API
You can retrieve scan errors through the scan-manager query API:
GET /scan-errorreturns scan error records.GET /scan-error/countreturns scan error counts.
Both endpoints take a gql query object. There is no scanId path parameter, so filter by scan inside the gql query. Each record includes the
item path or identifier, error code, error message, and timestamp.