Understanding Usage graphs in Proxy logs
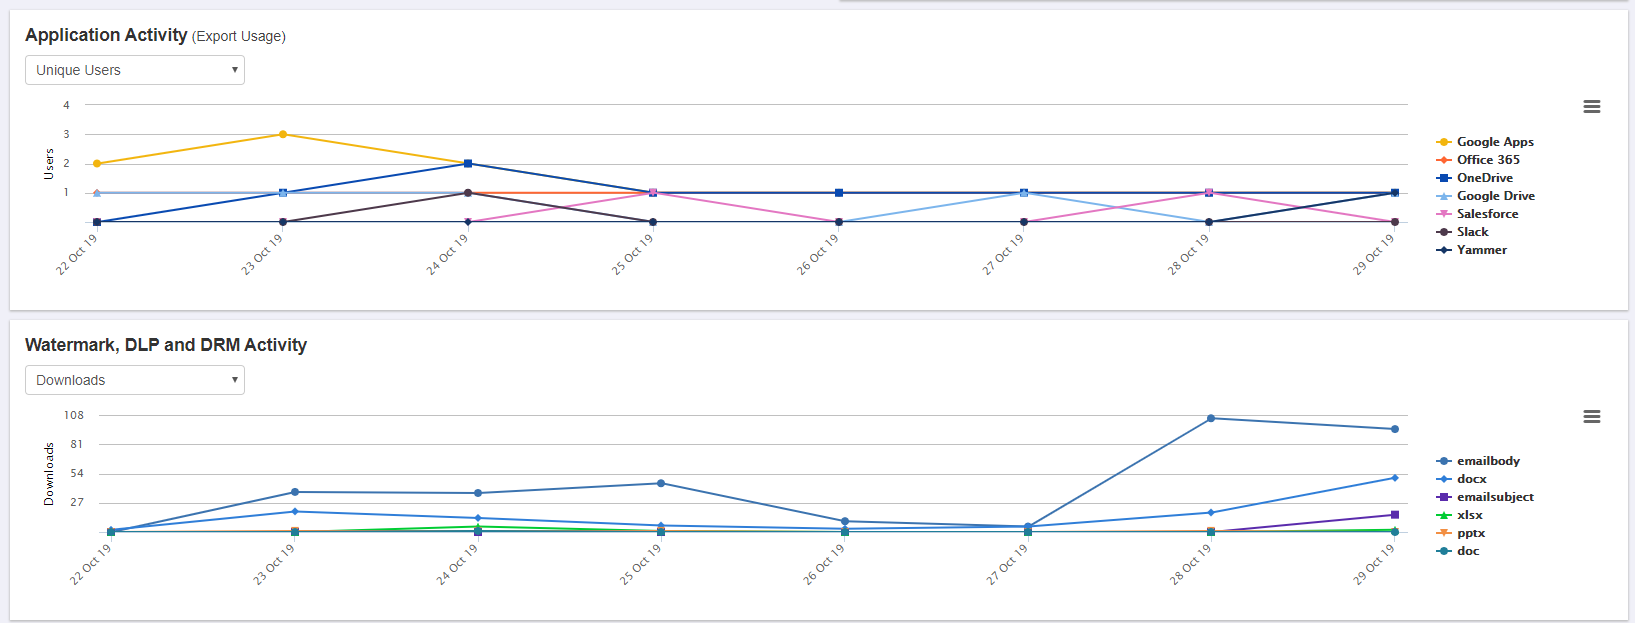
The Application and File Activity graphs show you a breakdown of activity based on the selected view (example: Downloads vs. Uploads).
This helps to get a visual sense of how applications and files are being used in the enterprise. The time period displayed corresponds to the time period selected in the Display Filter. The time period granularity automatically displays in weeks, days, or hours depending on how many results are yielded by the current Display filter.

From any graph view you can:
- Click on the legend to change the view to a single app or cmd/ctrl click multiple apps to compare activity. The Y axis will auto-adjust based on your clicks so you get a better view of interesting data.
- Mouse over data points to see a pop-up showing exact dates and values for a particular point in time.
Application Activity Graph

The Application Activity graph can display the following:
- Unique Users: Number of unique users accessing each application.
- Downloads: Number of files downloaded.
- Usage: Total number of requests through the proxy.
- Uploads: Number of files uploaded.
Note:
Office 365 has 4 apps that are tracked separately:
- Yammer - Requests made only to Yammer.
- OneDrive - Requests made only to One Drive.
- Sharepoint - Requests made only to Sharepoint.
- Office 365 - Requests made to any other Office 365 applications excluding the applications above.
GSuite has 2 apps that are tracked separately:
- Google Drive: Requests made only to Google Drive.
- Google Apps: Requests made to any Google application excluding requests from Google Drive.
Watermark, DLP and DRM Activity Graph
The Watermark, DLP and DRM Activity graph shows specific activity that triggered a policy. You can view by:

- Downloads: Number of downloads of each file type.
- Uploads: Number of uploads of each file type.
- File Views: Number of callback events registered in Forcepoint Data Security Cloud | SSE by file type.