Understanding the Browse Activity Summary widget
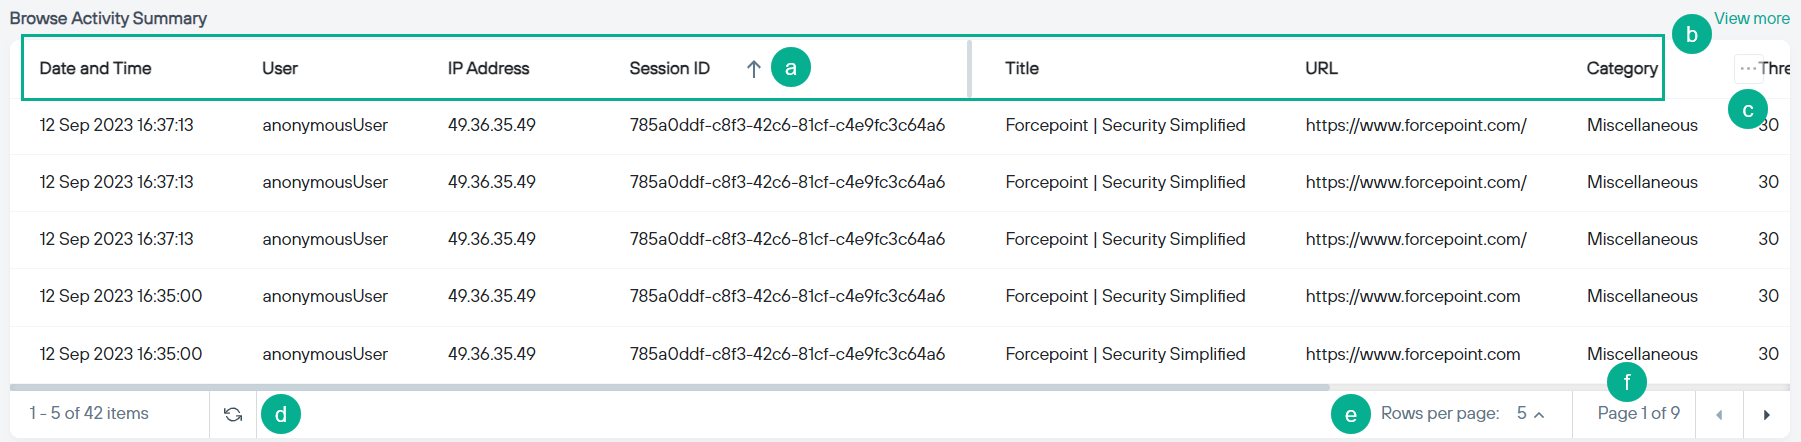
The Browse Activity Summary widget displays cumulative browsing activity and related security events per user for the selected period.
Steps
-
Navigate to the
 icon to access the Remote Browser Isolation dashboard.
- Select the data range for the dashboard.
-
On the Browse Activity Summary widget:
-
Click on any of the column names in the table header to sort the data in ascending or descending order.
-
Click the
 icon to open the dialog where you can hide or display optional columns.
-
Click the
 icon to refresh the data in table.
-
Click on any of the column names in the table header to sort the data in ascending or descending order.
Browse Activity Summary field descriptions
| Field | Description |
|---|---|
| Date and Time | Time stamp of the event. |
| User | Name of the user who was responsible for the event. |
| IP Address | IP address of the user's device. |
| Session ID | RBI session ID. |
| Title | Title of the web page. |
| URL | URL browsed in isolation. |
| Category | Category of the URL browsed. |
| Threat Score | Threat score of the browsed site. |
| Rendering Status | Status of site browsed. |
| Client Browser | Type of the browser used to browse the website (example: Chrome, Edge and so on). |