Viewing Remote Browser Isolation Reports
You can view the log reports in the Remote Browser Isolation dashboard.
To review logs in detail, you can click the View more link while viewing the Browse Activity Summary or Security Threat Summary widget under the Web Security tab or the Download Summary or Upload Summary widget under the File Security tab.
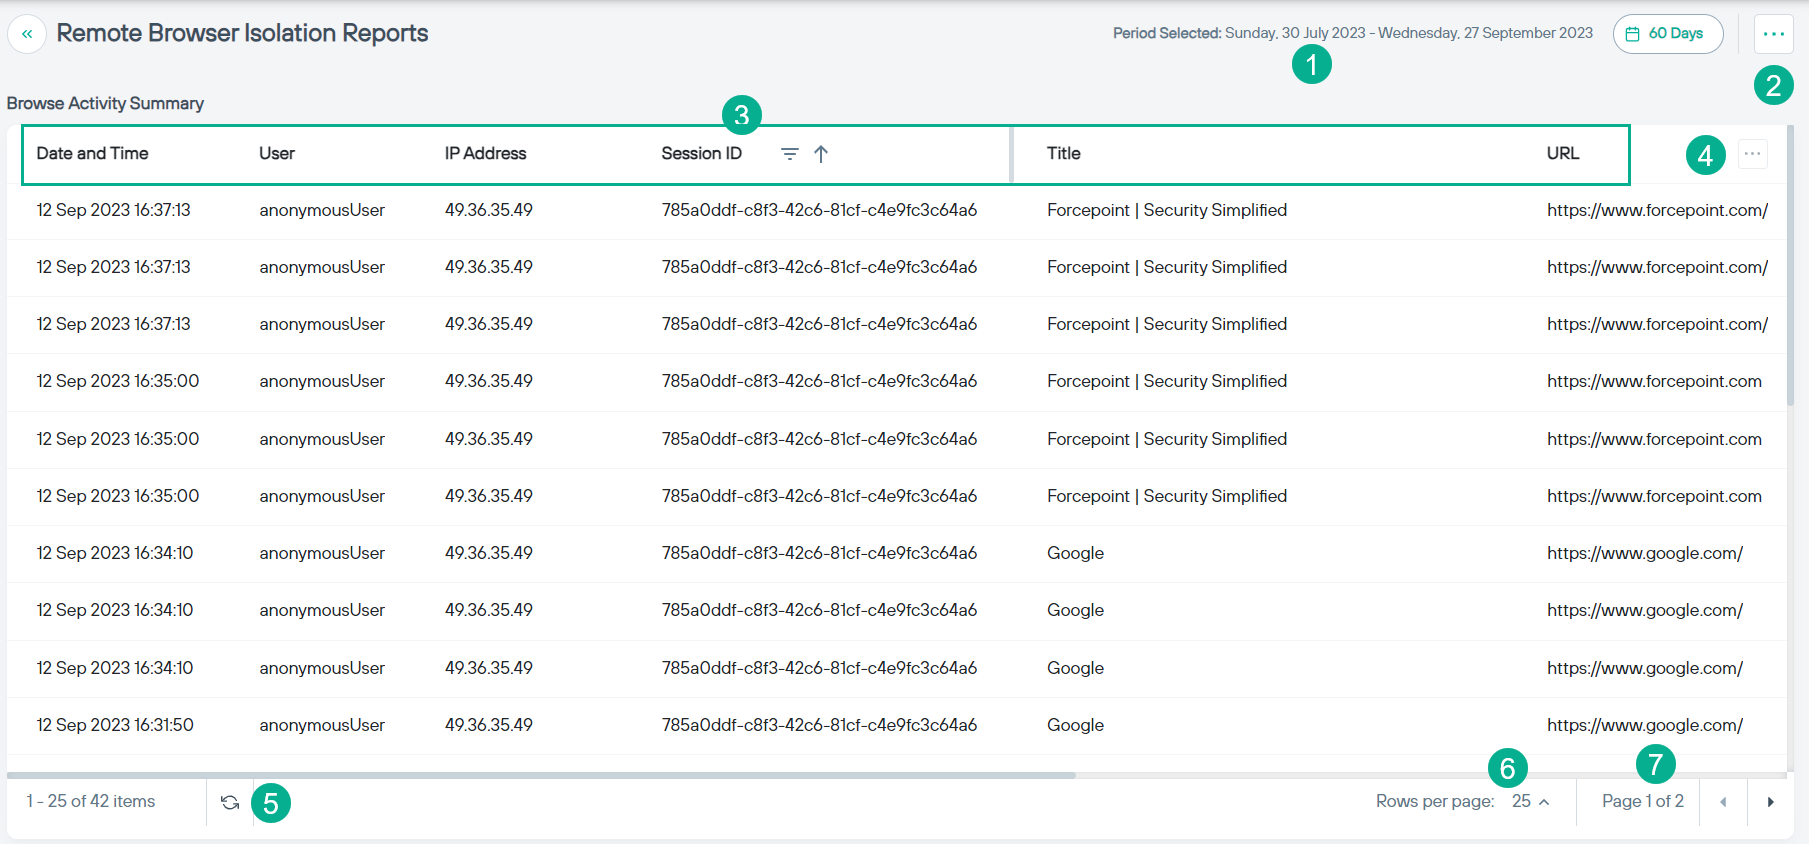
- 1
- Click the time filter to view the past 7 days, 14 days, 30 days, 45 days or 60 days data for all widgets on the dashboard. By default, report loads with a 30 days' time filter.
- 2
- Click the
 icon to expand the dropdown and select one of the following options to download the report:
- Export as PDF
- Export as Excel
- Export as CSV
- 3
- Click on any of the column names in the table header to sort the data in ascending or descending order.
- 4
- Click the icon to open the dialog where you can hide or display optional columns.
- 5
- Click the
 icon to refresh the data in table.
 - 6
- Select the number of rows to show in the table. You can select to show either 25, 50, 100 or 200 rows.
- 7
- Indicates the page number of the table you are viewing.