Exporting a dashboard or dashboard group as a PDF file
You can export any of the dashboard or dashboard group as a PDF file.
Steps
-
On the left pane, click the
 icon.
The Catalog page opens displaying the Dashboards tab details.
-
To expand the Global folder and view the sub-folders, click the expand
 icon.
icon.
- Navigate to appropriate sub-folder by expanding the sub-folders.
-
To view the dashboard or dashboard group details, identify and click on it.
The dashboard or dashboard group opens in view mode.
-
Select the time filter for your dashboard or dashboard group.
-
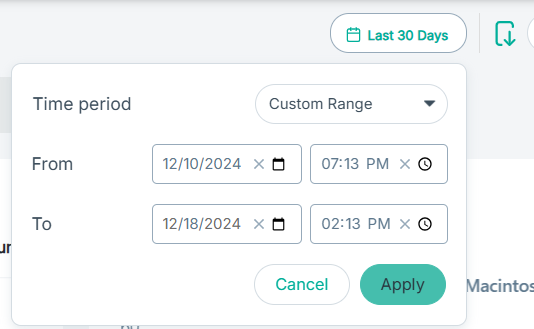
Click the time filter.
The dialog opens.
-
To filter logs based on selected Time period, select one of the following:
- Last Hour
- Last 24 Hours
- 7 Days
- 14 Days
- 30 Days
- 45 Days
- 60 Days
- Custom Range
-
If you have selected the Custom Range option, then:
- To select a From date for your transaction view, enter a date or select the date from the calendar and then click the time icon to select the time range.
- To select a To date for your transaction view, enter a date or select the date from the calendar and then click the time icon to select the time range.

- To save the changes, click Apply.
Note: The date and time formats are the same as those configured on your system. -
Click the time filter.
- For the widgets with the Bar Chart, Column Chart, Pie Chart, Area Chart, and Line Chart, select the measure to be exported from the Measure to plot drop-down of the widget.
-
On the upper-right corner of the dashboard or dashboard group, click the
 icon.
icon.
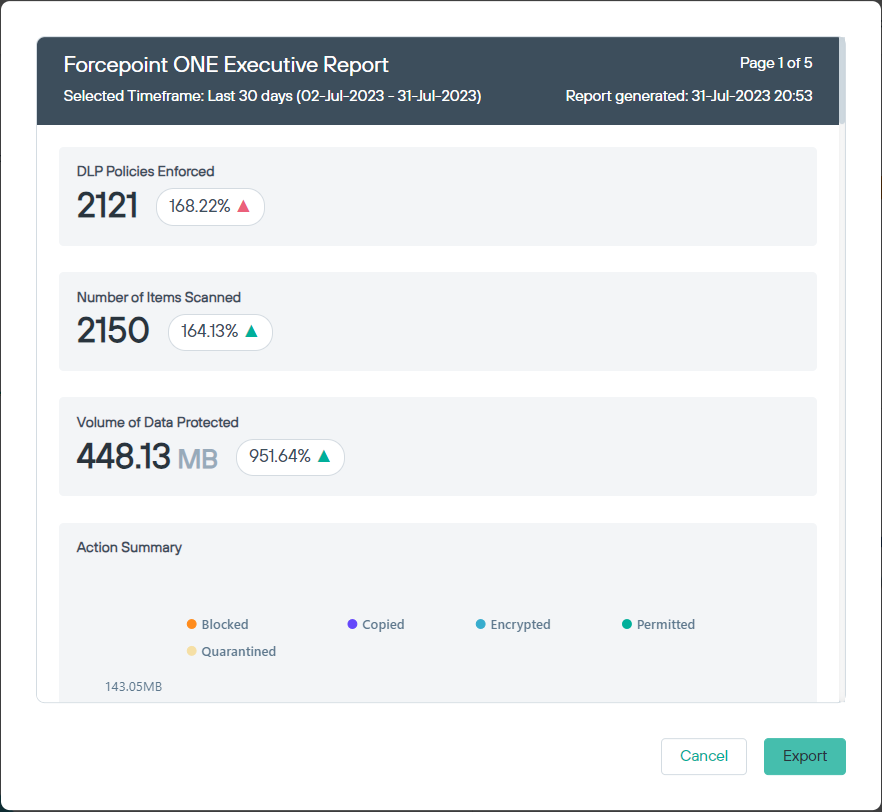
The preview of dashboard or dashboard group opens displaying the name, selected time frame for which dashboard was generated, and report generated date and time.

Note: If you are exporting a dashboard, the description appears in the preview if the option to display description in the PDF export was selected while creating the widget in the Discover page. - To continue with the export, click Export.
-
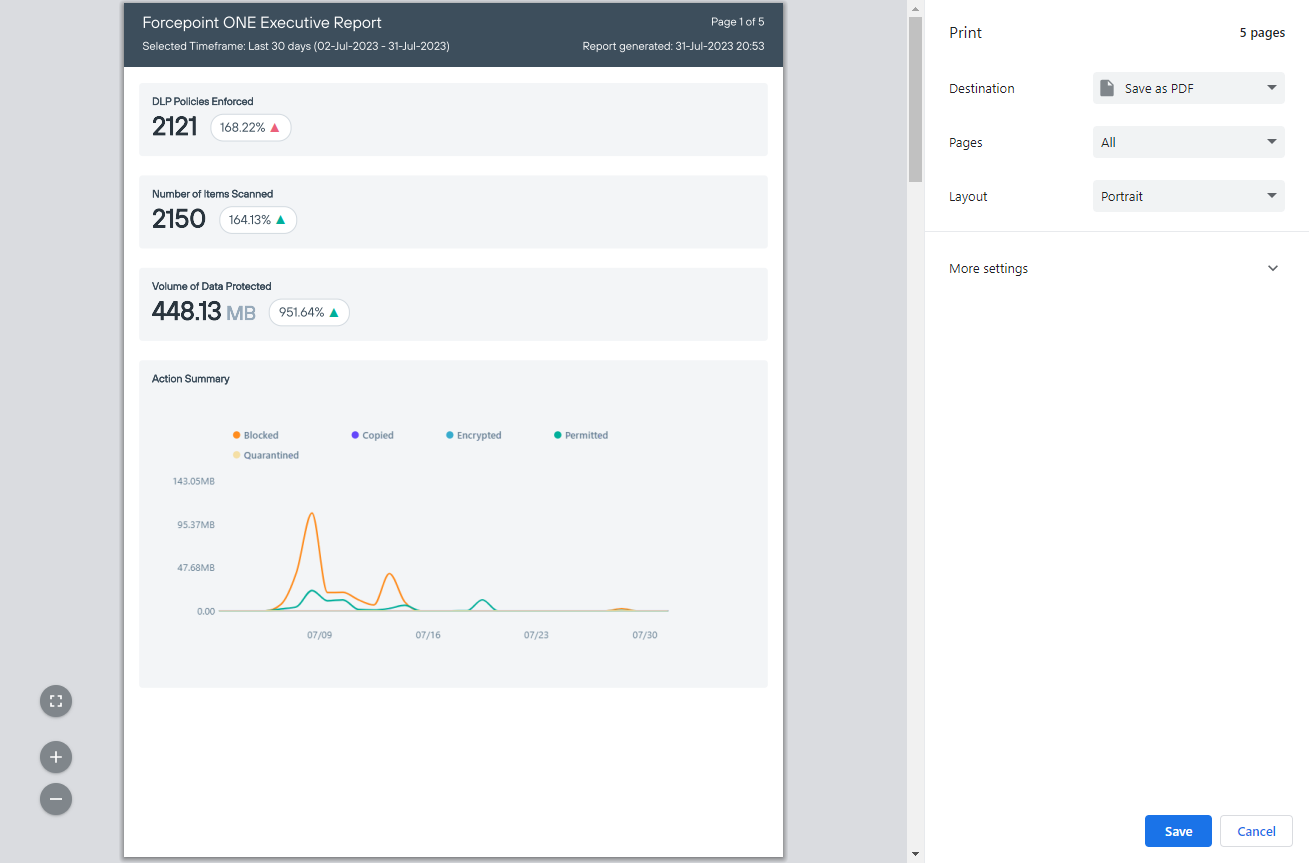
Adjust the print settings, if required.

- Click Save to save the dashboard or dashboard group as PDF to desired location, and then click Save.