Creating a dashboard group
You can group existing dashboards into a dashboard group. This is a dashboard that presents all grouped dashboards on a single page with a tab menu used to allow quick navigation between each individual dashboard. It allows the Dashboard Designer to group related dashboards.
Steps
-
On the left pane, click the
 icon.
The Catalog page opens displaying the Dashboards tab details.
-
To expand the Global folder and view the sub-folders, click the expand
 icon.
icon.
- Navigate to appropriate sub-folder by expanding the sub-folders.
-
To create a dashboard group in a sub-folder, select the sub-folder under which the dashboard group should be created and select the Dashboard Group option
from the Create new drop-down.
The Create dashboard group page opens.
- In the Collection Name, enter a unique name for the dashboard group.
- In the Description field, enter a description for the dashboard group.
- Assign the dashboard group to a folder. For more information, refer to Assigning a dashboard or widget to the folder.
-
In the Tags field, enter any tags associated with the dashboard group.
You need to add at least one tag.
-
To pin the dashboard group, toggle the Pin Collection to Enabled.
By default, the Pin Collection is set to Disabled.
-
On the Included Dashboards section:
- Enter text in the Search field to filter dashboards based on the text.
-
Select all the required dashboards that need to be part of dashboard group.
You can add a maximum of six dashboards.
-
Click + to move selected dashboards from the Select Dashboards section to the Applied to this collection
(arrangement defines order) section.
All the dashboards in the Applied to this collection (arrangement defines order) section appear as tabs in the same sequence as is in the Applied to this collection (arrangement defines order) section at the end of the page.
- Click - to remove selected dashboards from the Applied to this collection (arrangement defines order) section and move back to the Select Dashboards section.
- In the Applied to this collection (arrangement defines order) section, drag and drop the dashboard to desired location to rearrange dashboards in sequence.
-
To view the dashboard in a new page, click the View Dashboard
 icon adjacent to the dashboard name.
-
To filter all the widgets in the dashboard:
-
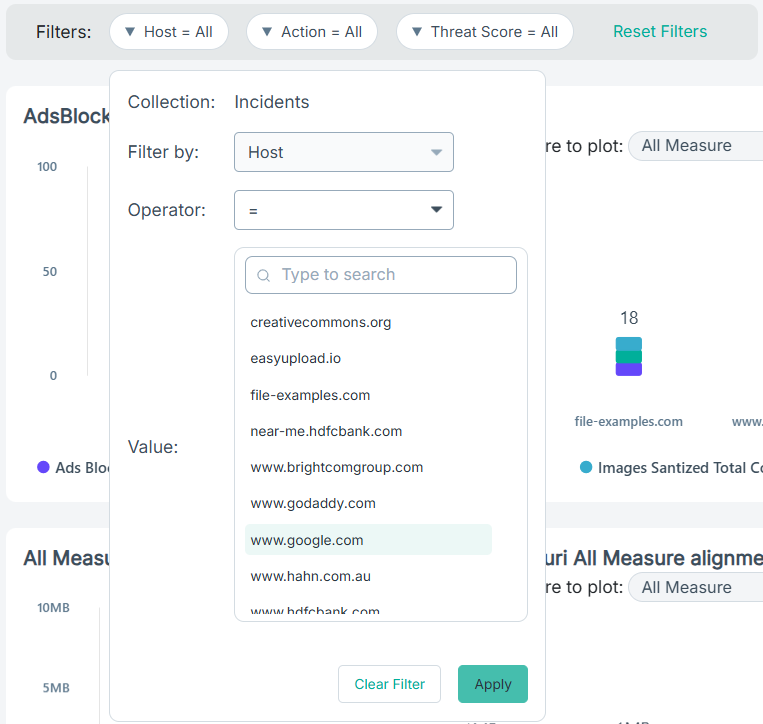
On the Filters section, click the filter you want to apply.
The dialog opens for the filter selected displaying the Collection the filter belongs to, the filter applied, the operator applied, and possible values of the filter.

- From the Operator drop-down, select the method of comparison to be used when comparing widgets with the value selected.
- Based on the Operator selected, enter text or select the value(s) to filter with.
- To clear the selected operator and value(s), click Clear Filter, if required.
-
To filter all the widgets in the dashboard based on the selected operator and value(s), click Apply.
The Filters section displays the filter with selected operator and value(s).

If the applied filter does not apply to the widget(s) in the dashboard, then such widget(s) are displayed in a read-only state and blurred.

- To reset the filter to the default state defined while creating or modifying the dashboard, click Reset Filters, if required.
To modify the available filters in the dashboard, refer to Adding filters in the dashboard. -
On the Filters section, click the filter you want to apply.
-
Adjust the time period for your dashboard group.
-
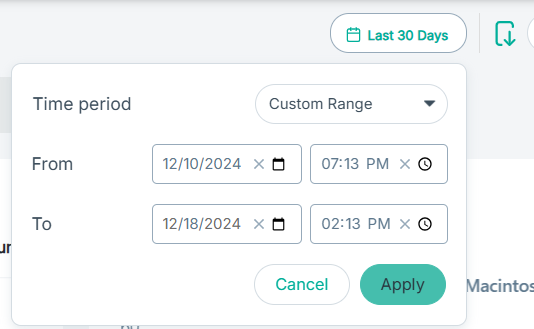
Click the time filter.
The dialog opens.
-
To filter logs based on selected Time period, select one of the following:
- Last Hour
- Last 24 Hours
- 7 Days
- 14 Days
- 30 Days
- 45 Days
- 60 Days
- Custom Range
-
If you have selected the Custom Range option, then:
- To select a From date for your transaction view, enter a date or select the date from the calendar and then click the time icon to select the time range.
- To select a To date for your transaction view, enter a date or select the date from the calendar and then click the time icon to select the time range.

Note: The date and time formats are the same as those configured on your system. - To save the changes, click Apply.
-
Click the time filter.
-
To create and save the dashboard group:
- Click Save and Close to save the dashboard group with entered details and to redirect you to the Dashboards tab.
- Click Save to save the dashboard group with entered details and to redirect you to view mode of dashboard.