Creating a custom dashboard
You can create a custom dashboard as per your organization's need.
Steps
- 
                On the left pane, click the  icon.
                The Catalog page opens displaying the Dashboards tab details. icon.
                The Catalog page opens displaying the Dashboards tab details.
 
- 
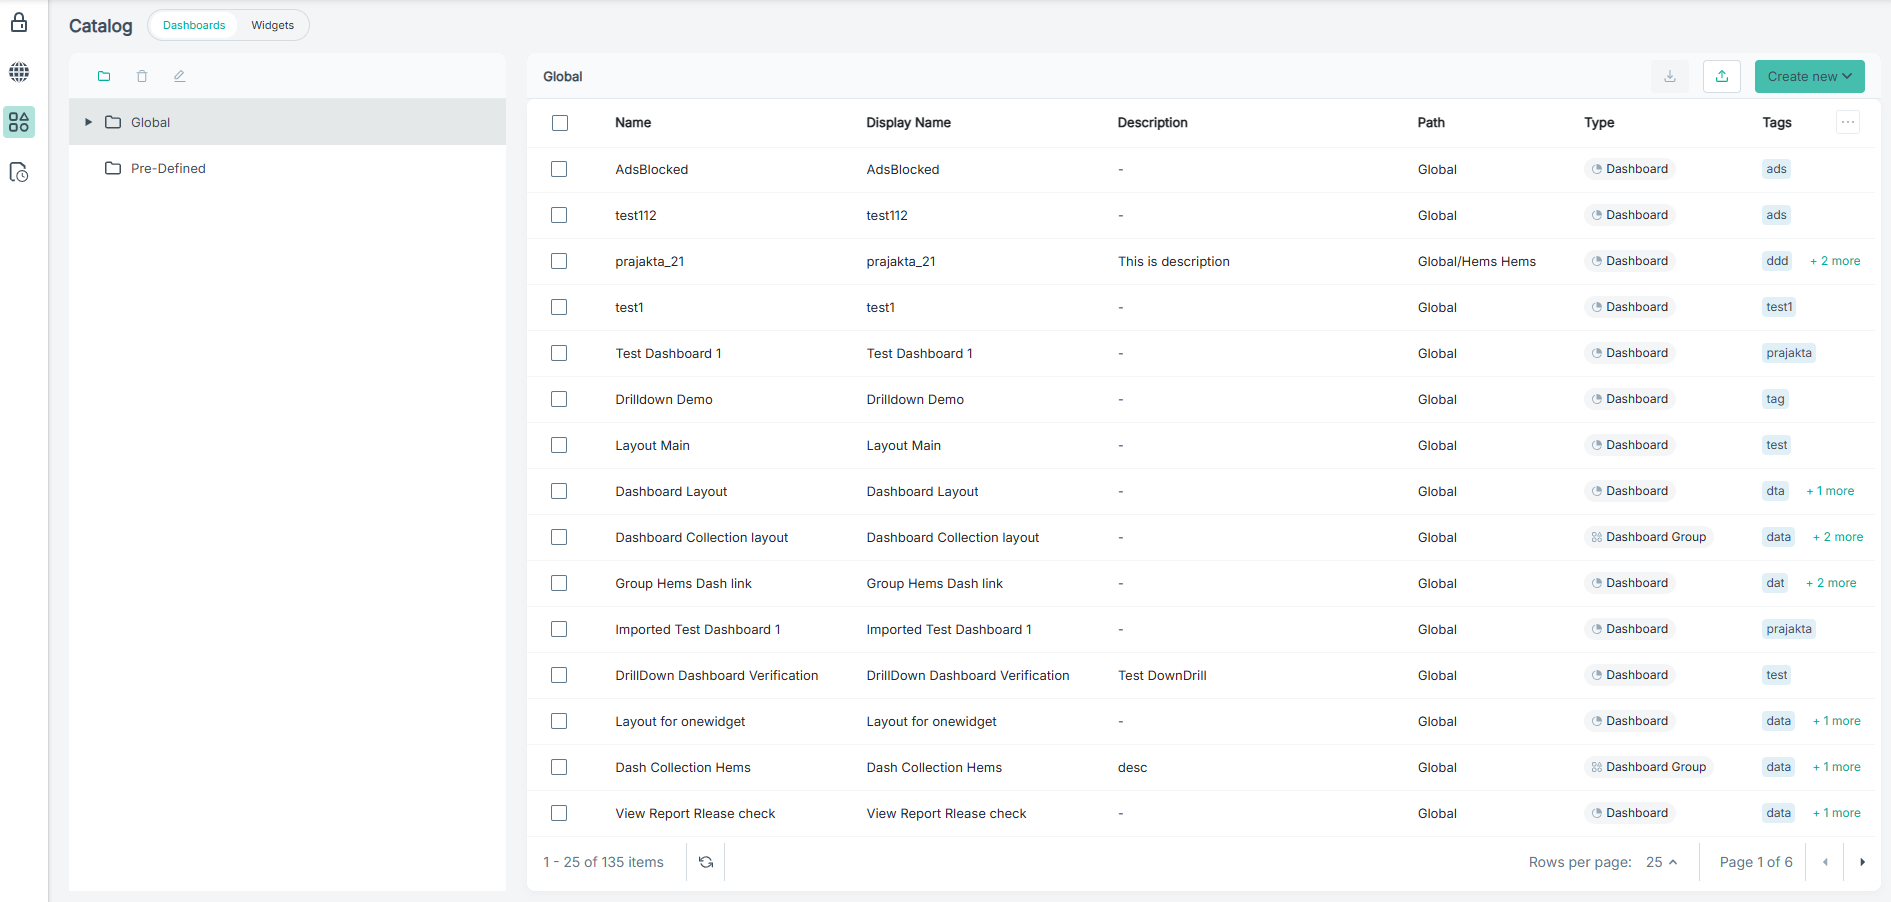
                To expand the Global folder and view the sub-folders, click the expand  icon. icon.
- Navigate to appropriate sub-folder by expanding the sub-folders.
- 
                To create a custom dashboard in a sub-folder, select the sub-folder first before selecting the Dashboard option from the Create New
                    drop-down.
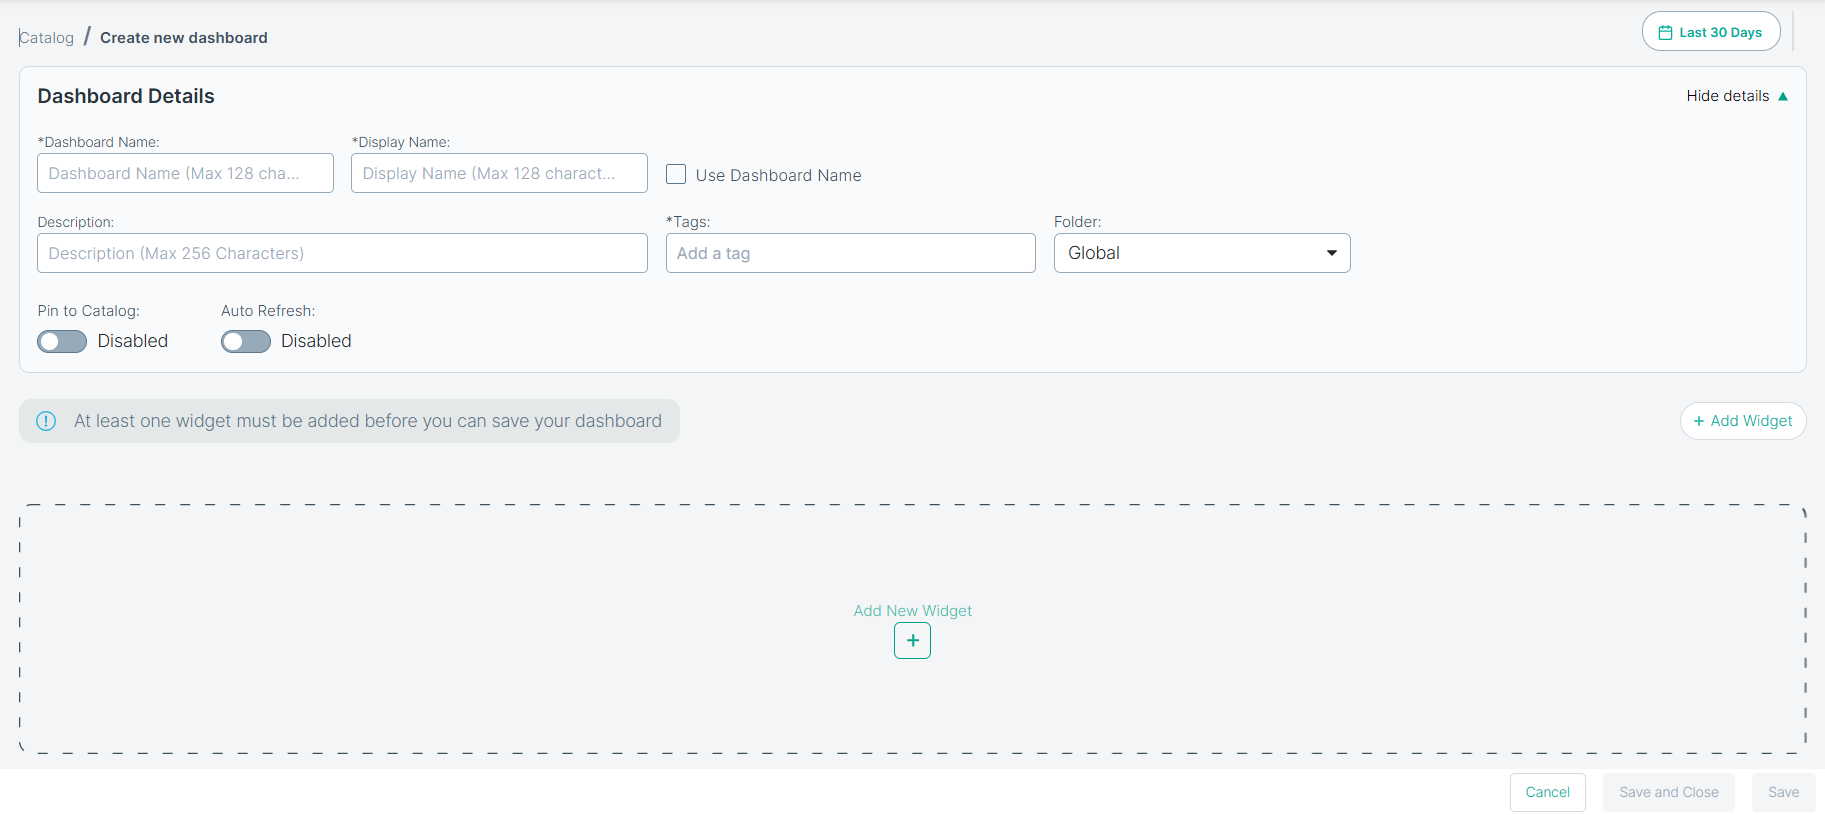
                The Create new dashboard page opens. 
 
- In the Dashboard Name, enter a unique name for the dashboard.
- In the Description field, enter the description for the dashboard.
- Assign the dashboard to a folder. For more information, refer to Assigning a dashboard or widget to the folder.
- 
                In the Tags field, enter any tags associated with the dashboard.
                You need to add at least one tag.
- 
                To pin the dashboard, toggle the Pin Dashboard to Enabled.
                By default, the Pin Dashboard is set to Disabled.
- 
                From the Dashboard Layout field, select the preset for building the dashboard.
                Available options are 1 Column, 2 Columns and 3 Columns. By default, the 2 Columns layout is selected. 
- 
                To add a widget to the dashboard, click Add new widget.
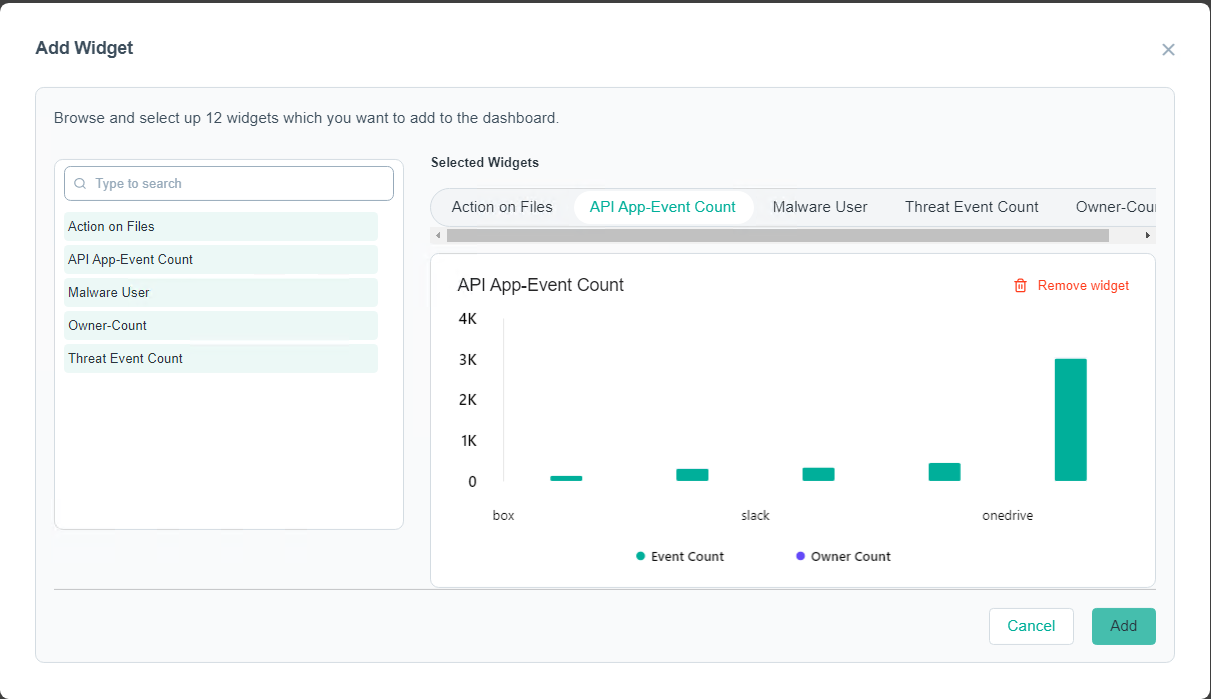
                The Add widget dialog opens displaying list of existing widgets. 
 CAUTION:You need to add at least one widget to the dashboard to save the dashboard.
- Filter all the widgets in the dashboard. Refer to Adding filters in the dashboard.
- 
                Adjust the time period for your dashboard.
                - 
                        Click the time filter.
                        The dialog opens. 
- 
                        To filter logs based on selected Time period, select one of the following:
                        - Last Hour
- Last 24 Hours
- 7 Days
- 14 Days
- 30 Days
- 45 Days
- 60 Days
- Custom Range
 
- 
                        If you have selected the Custom Range option, then:
                        - To select a From date for your transaction view, enter a date or select the date from the calendar and then click the time icon to select the time range.
- To select a To date for your transaction view, enter a date or select the date from the calendar and then click the time icon to select the time range.
  
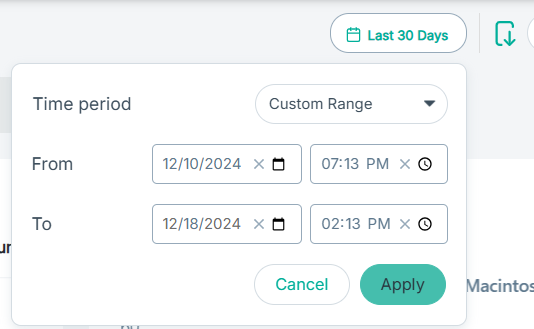
 Note: The date and time formats are the same as those configured on your system.
- To save the changes, click Apply.
 
- 
                        Click the time filter.
                        
- 
                To create and save the dashboard:
                - Click Save and Close to save the dashboard with the details entered and to redirect you to the Dashboards tab.
- Click Save to save the dashboard with the details entered and to redirect you to view mode of dashboard.