Viewing a dashboard
You can view the dashboard details from the Dashboards tab of the Catalog page.
Steps
-
On the left pane, click the
 icon.
The Catalog page opens displaying the Dashboards tab details.
-
To expand the Global folder and view the sub-folders, click the expand
 icon.
icon.
- Navigate to appropriate sub-folder by expanding the sub-folders.
-
To view the dashboard details, identify the dashboard and click on it.
The dashboard opens in view mode.
-
To filter all the widgets in the dashboard:
-
On the Filters section, click the filter you want to apply.
The dialog opens for the filter selected displaying the Collection the filter belongs to, the filter applied, the operator applied, and possible values of the filter.
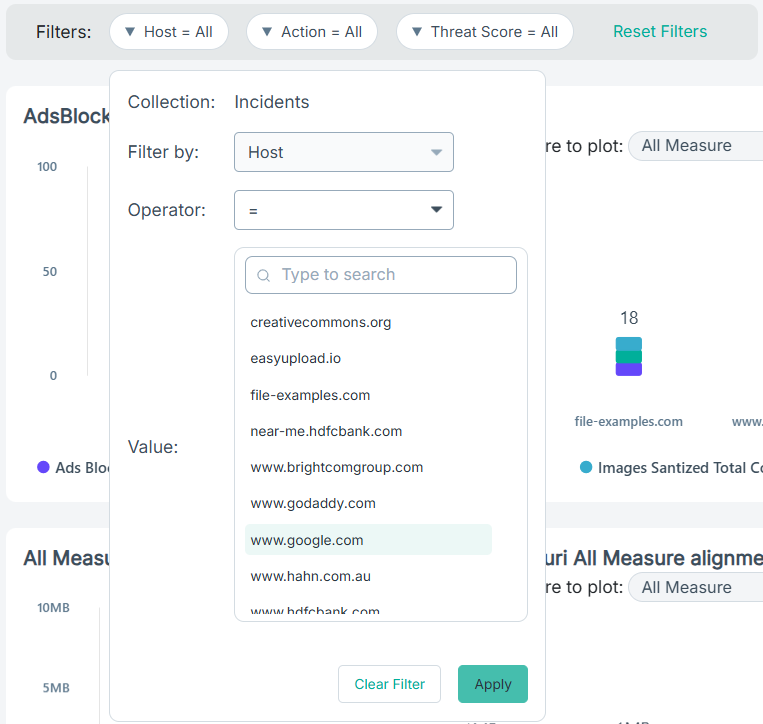
- From the Operator drop-down, select the method of comparison to be used when comparing widgets with the value selected.
- Based on the Operator selected, enter text or select the value(s) to filter with.
- To clear the selected operator and value(s), click Clear Filter, if required.
-
To filter all the widgets in the dashboard based on the selected operator and value(s), click Apply.
The Filters section displays the filter with selected operator and value(s).

If the applied filter does not apply to the widget(s) in the dashboard, then such widget(s) are displayed in a read-only state and blurred.

- To reset the filter to the default state defined while creating or modifying the dashboard, click Reset Filters, if required.
To modify the available filters in the dashboard, refer to Adding filters in the dashboard. -
On the Filters section, click the filter you want to apply.
-
To view the report underlying the widget in the dashboard:
-
Place your mouse pointer on the widget and click the View link.
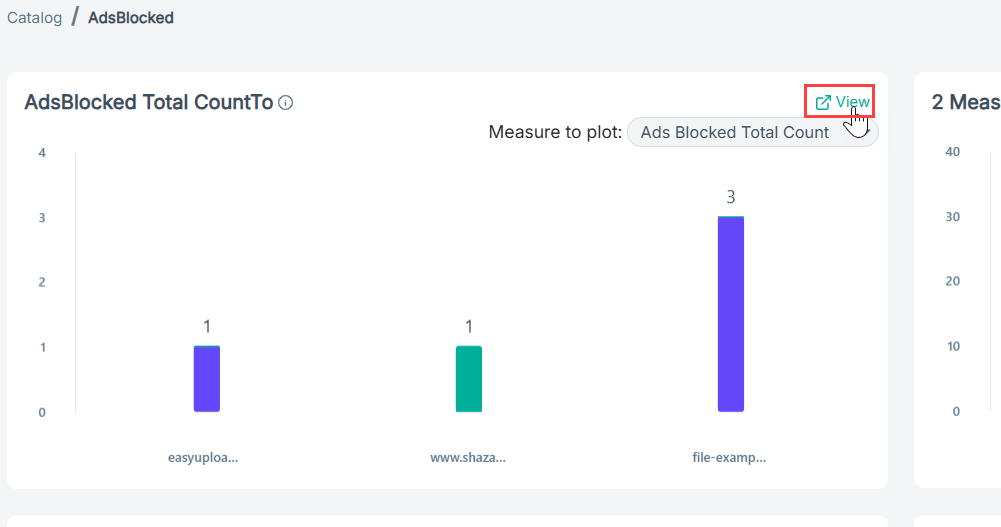
The widget opens in the Discover page in view mode.
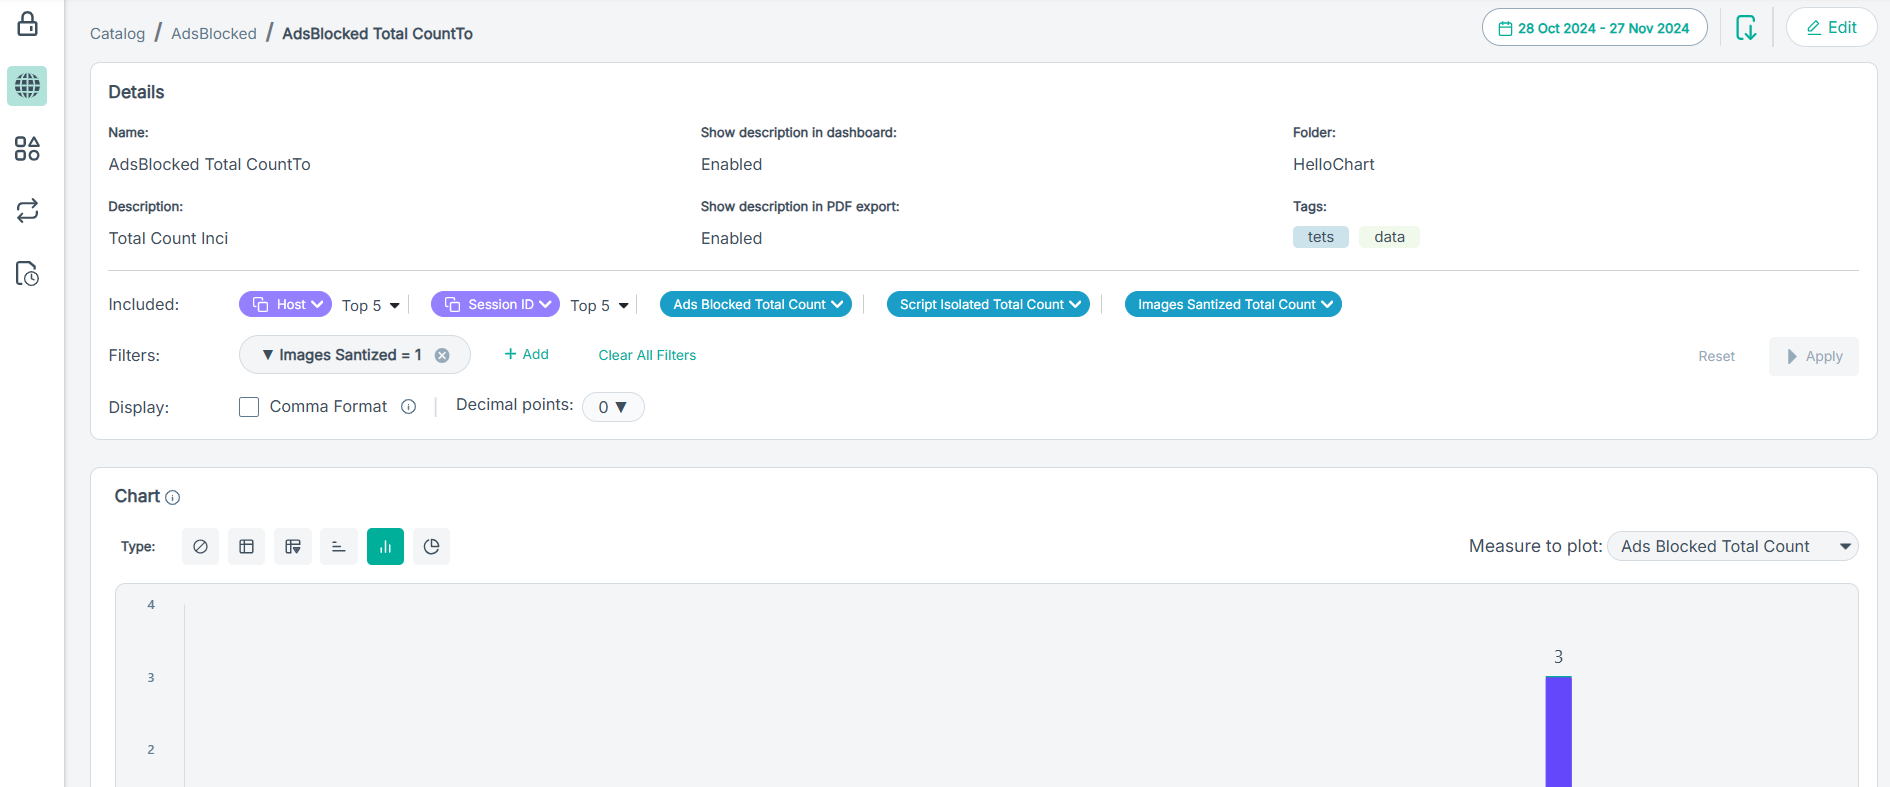
- If required, modify the widget.
- To navigate back to dashboard view, click the dashboard name on the breadcrumb located on the upper-right corner of the page.
To hide the View link for the widget, refer to Configuring advanced options in the dashboard. -
Place your mouse pointer on the widget and click the View link.
-
To drilldown from a widget in the dashboard:
- Right-click the chart object.
-
From the DrillDown By dialog, select one of the options to drilldown based on the selected option.
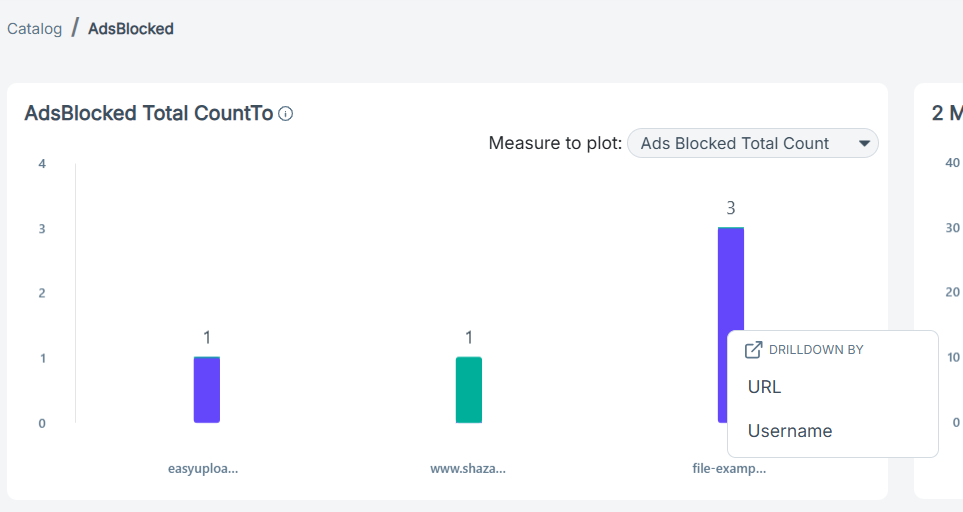
The options in the DrillDown By dialog vary based on the dimensions selected while configuring advanced options.
The widget opens in the Discover page in view mode with filters applied based on the selected drilldown option.
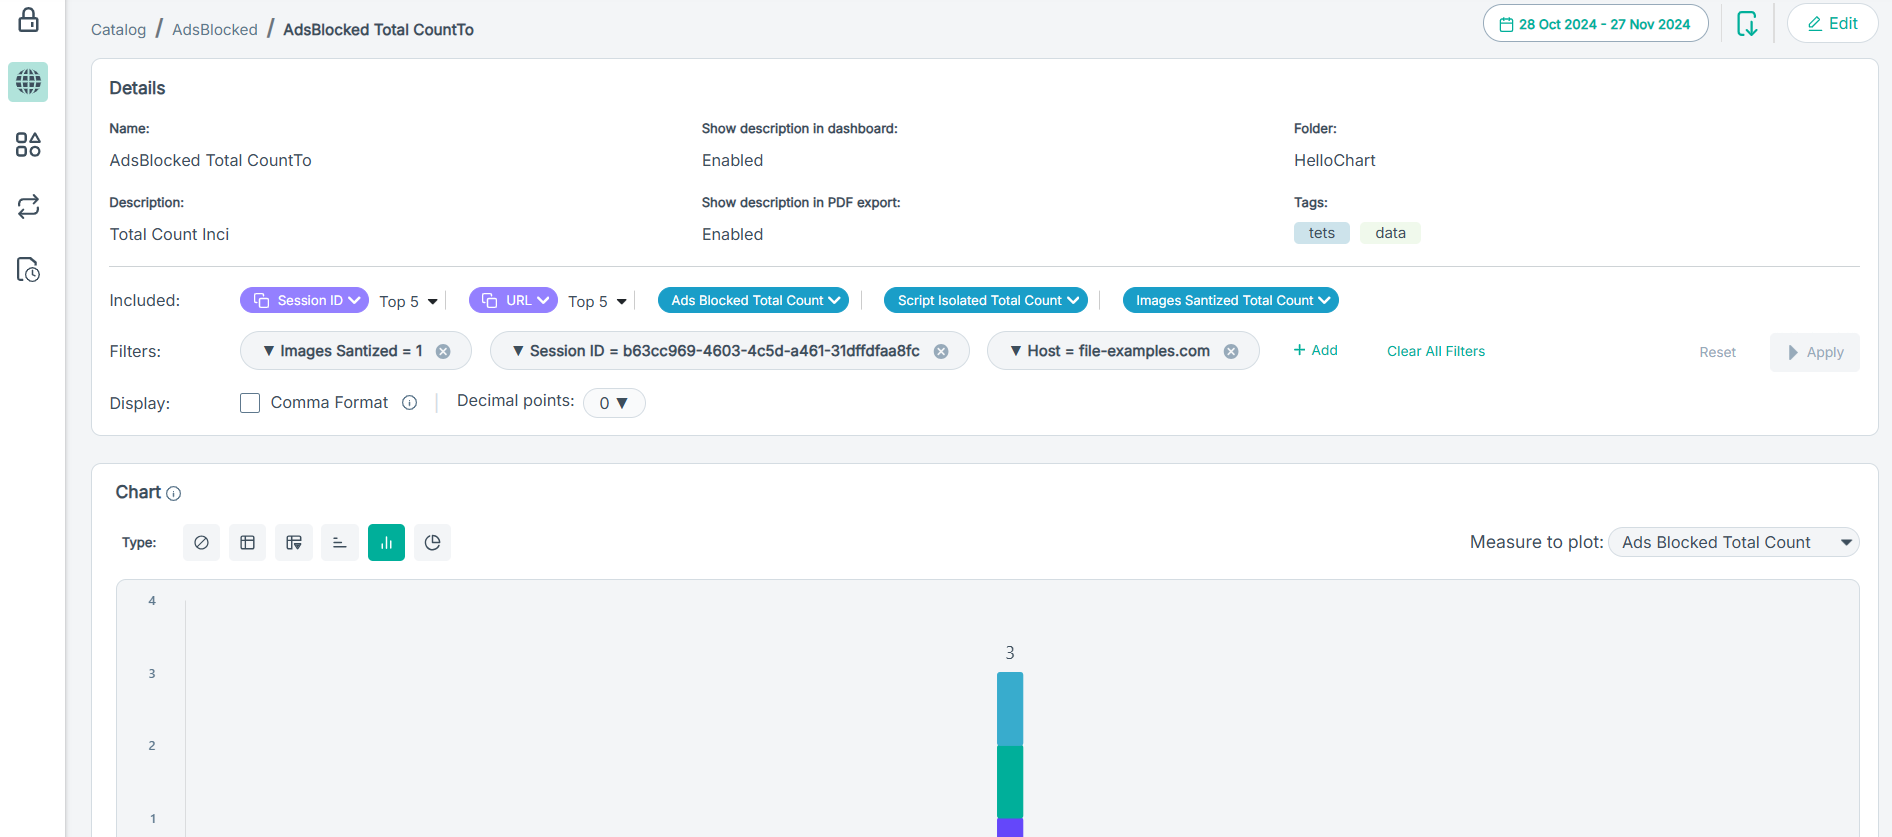
- If required, modify the widget.
- To navigate back to dashboard view, click the dashboard name on the breadcrumb located on the upper-right corner of the page.
To enable the drilldown capability for the widget, refer to Configuring advanced options in the dashboard. -
If required, click
 and select one of the following options:
- Pin Dashboard: Select the Pin Dashboard option to pin the dashboard. Once the dashboard is pinned, the Pin
Dashboard option is changed to Unpin Dashboard.
You can click the Unpin Dashboard option to unpin the dashboards which are already pinned.
- Delete Dashboard: Select this option to delete the dashboard.
- Pin Dashboard: Select the Pin Dashboard option to pin the dashboard. Once the dashboard is pinned, the Pin
Dashboard option is changed to Unpin Dashboard.
-
Adjust the time period for your dashboard.
-
Click the time filter.
The dialog opens.
-
To filter logs based on selected Time period, select one of the following:
- Last Hour
- Last 24 Hours
- 7 Days
- 14 Days
- 30 Days
- 45 Days
- 60 Days
- Custom Range
-
If you have selected the Custom Range option, then:
- To select a From date for your transaction view, enter a date or select the date from the calendar and then click the time icon to select the time range.
- To select a To date for your transaction view, enter a date or select the date from the calendar and then click the time icon to select the time range.
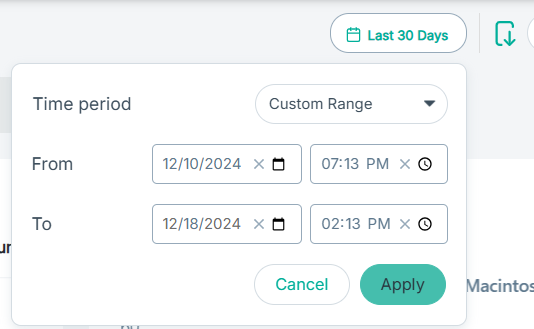
Note: The date and time formats are the same as those configured on your system. - To save the changes, click Apply.
-
Click the time filter.
-
To edit the dashboard details and widgets, click Edit.
To edit the dashboard, refer to Modifying the existing custom dashboard.