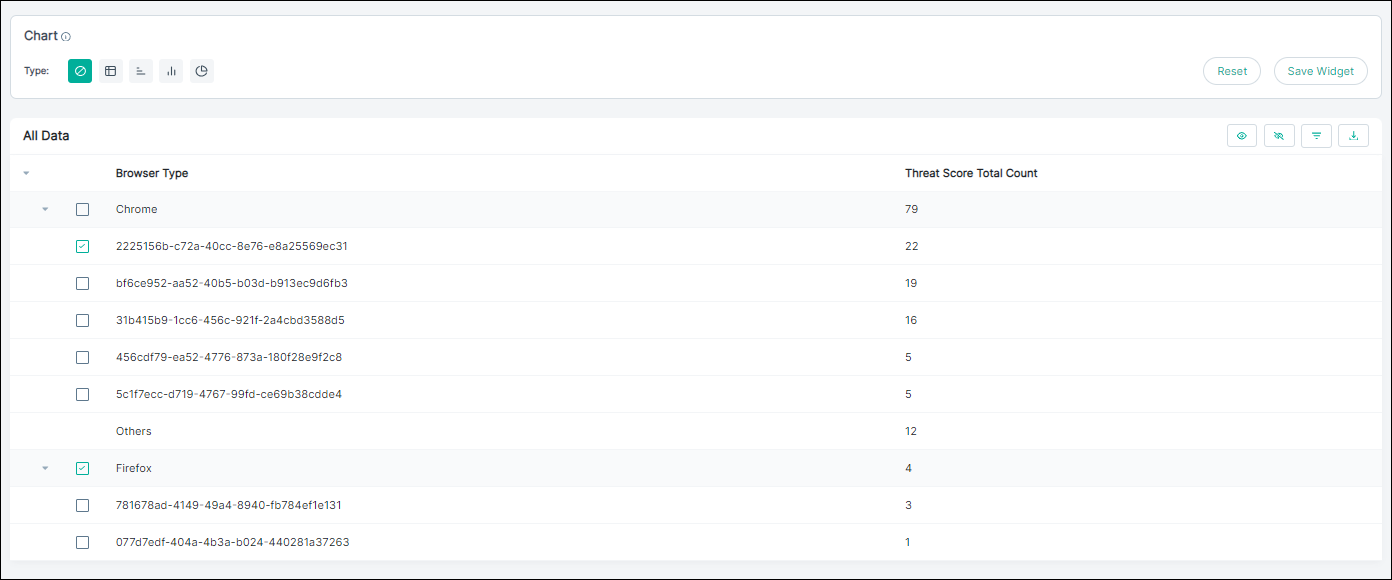
Filtering result data using the pivot view
You can filter and view the detailed data of the selected data source in pivot chart. You can also filter data using the advanced filter option available in the All Data section of Pivot table view.
Steps
-
In the All Data section, select the required data check boxes.
The options to filter data appear.
-
To display data of the selected dimensions only, select
 .
.
-
To remove data of the selected dimensions, select
 .
.
-
To filter data at the All Data section, use the advanced filter:
-
Select
 .
The Advanced Filter dialog opens.
.
The Advanced Filter dialog opens.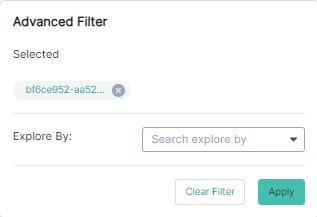
-
Select
-
To export data to CSV format, select
 .
.